

Giving an account of the history of the world is an ancient practice. As long as people have recognized a world, they have sought to explain how it came to be, and how and why it, and their experience of it, has changed over time. For millennia, the “known” world in these accounts was very local. As societies came into contact with one another, sometimes peacefully, sometimes violently, these known worlds became ever larger, and stories of world history had to change to make sense of new situations.
Learning history is not a matter of learning a given set of facts about the past. It involves an ongoing process of making sense of evidence and evaluating the significance of that evidence. Historians most often rely on documented accounts of what happened at a particular time and place, and work from these to explain how and why these events took place. Such documentation can take many forms. Historians commonly consult written documents such as personal letters and government or business records, if these are available. In other cases, historians work to interpret visual evidence from sources like paintings, drawings, tapestries, buildings, and, sometimes, the earth’s surface, particularly in places where it has changed noticeably. Maps, visual representations of aspects of the earth’s surface, can offer graphic evidence of how human views of the world have differed and how these views have themselves changed over time.

Humans in every corner of the earth have drawn maps as long as they have had tools to draw. Some maps were drawn to aid navigation, others to distinguish farming areas, or to locate settlements, hunting or fishing grounds, or religious sites. Still others were drawn to claim property or territory. As humans began to employ more sophisticated measuring, data-gathering, and visualizing techniques, maps became ways of understanding the earth’s shape, form, its place in the solar system, and the systems on its surface that have made sustaining life on it possible.
Maps have also come to be used to illustrate historical accounts, but have often done this in simplified—and problematic—ways. In the nineteenth and twentieth centuries “historical” maps were often drawn to promote particular political—or territorial—agendas. Many “historical” atlases presented history as a localized story of nation-building, depicting the spread of one particular color, to represent territorial control, across a landscape. Similar accounts of world history have used this technique of territorial coloring to depict the world as an amalgam of past, present, and future nation-states, even though this model of social and political organization—the nation-state—is a fairly recent phenomenon, and by no means a universal one.
The following selection of maps traces a broad arc across different traditions of thinking about the world and representing it. Some of these maps were drawn to explain the world’s shape, form, and content. Others were made for more immediately practical uses. All offer examples of how the earth’s surface has been understood by various people at various times. And all offer avenues for thinking about world history—what it means, how its study might be undertaken, and what ideas and evidence inform it.
Essential Questions
The emergence of global commerce in recent centuries, along with accompanying urbanization, radically reconfigured how humans lived, and how they understood the world. Most humans, for most of human history, ventured no more than a few miles from their birthplaces in their lives. Feudal systems long dominated the world’s heavily populated regions, binding most people to the land they worked, and to the authority of its hereditary rulers. While such systems were generally kept in place by coordinated political, economic, and spiritual authority, such as caste systems in South Asia or powerful dynasties in East Asia and Europe, in some places cracks began to appear in the feudal world, resulting in successive renegotiations of such arrangements, as well as greater geographical mobility for some. This enhanced mobility, in turn, called for new maps.
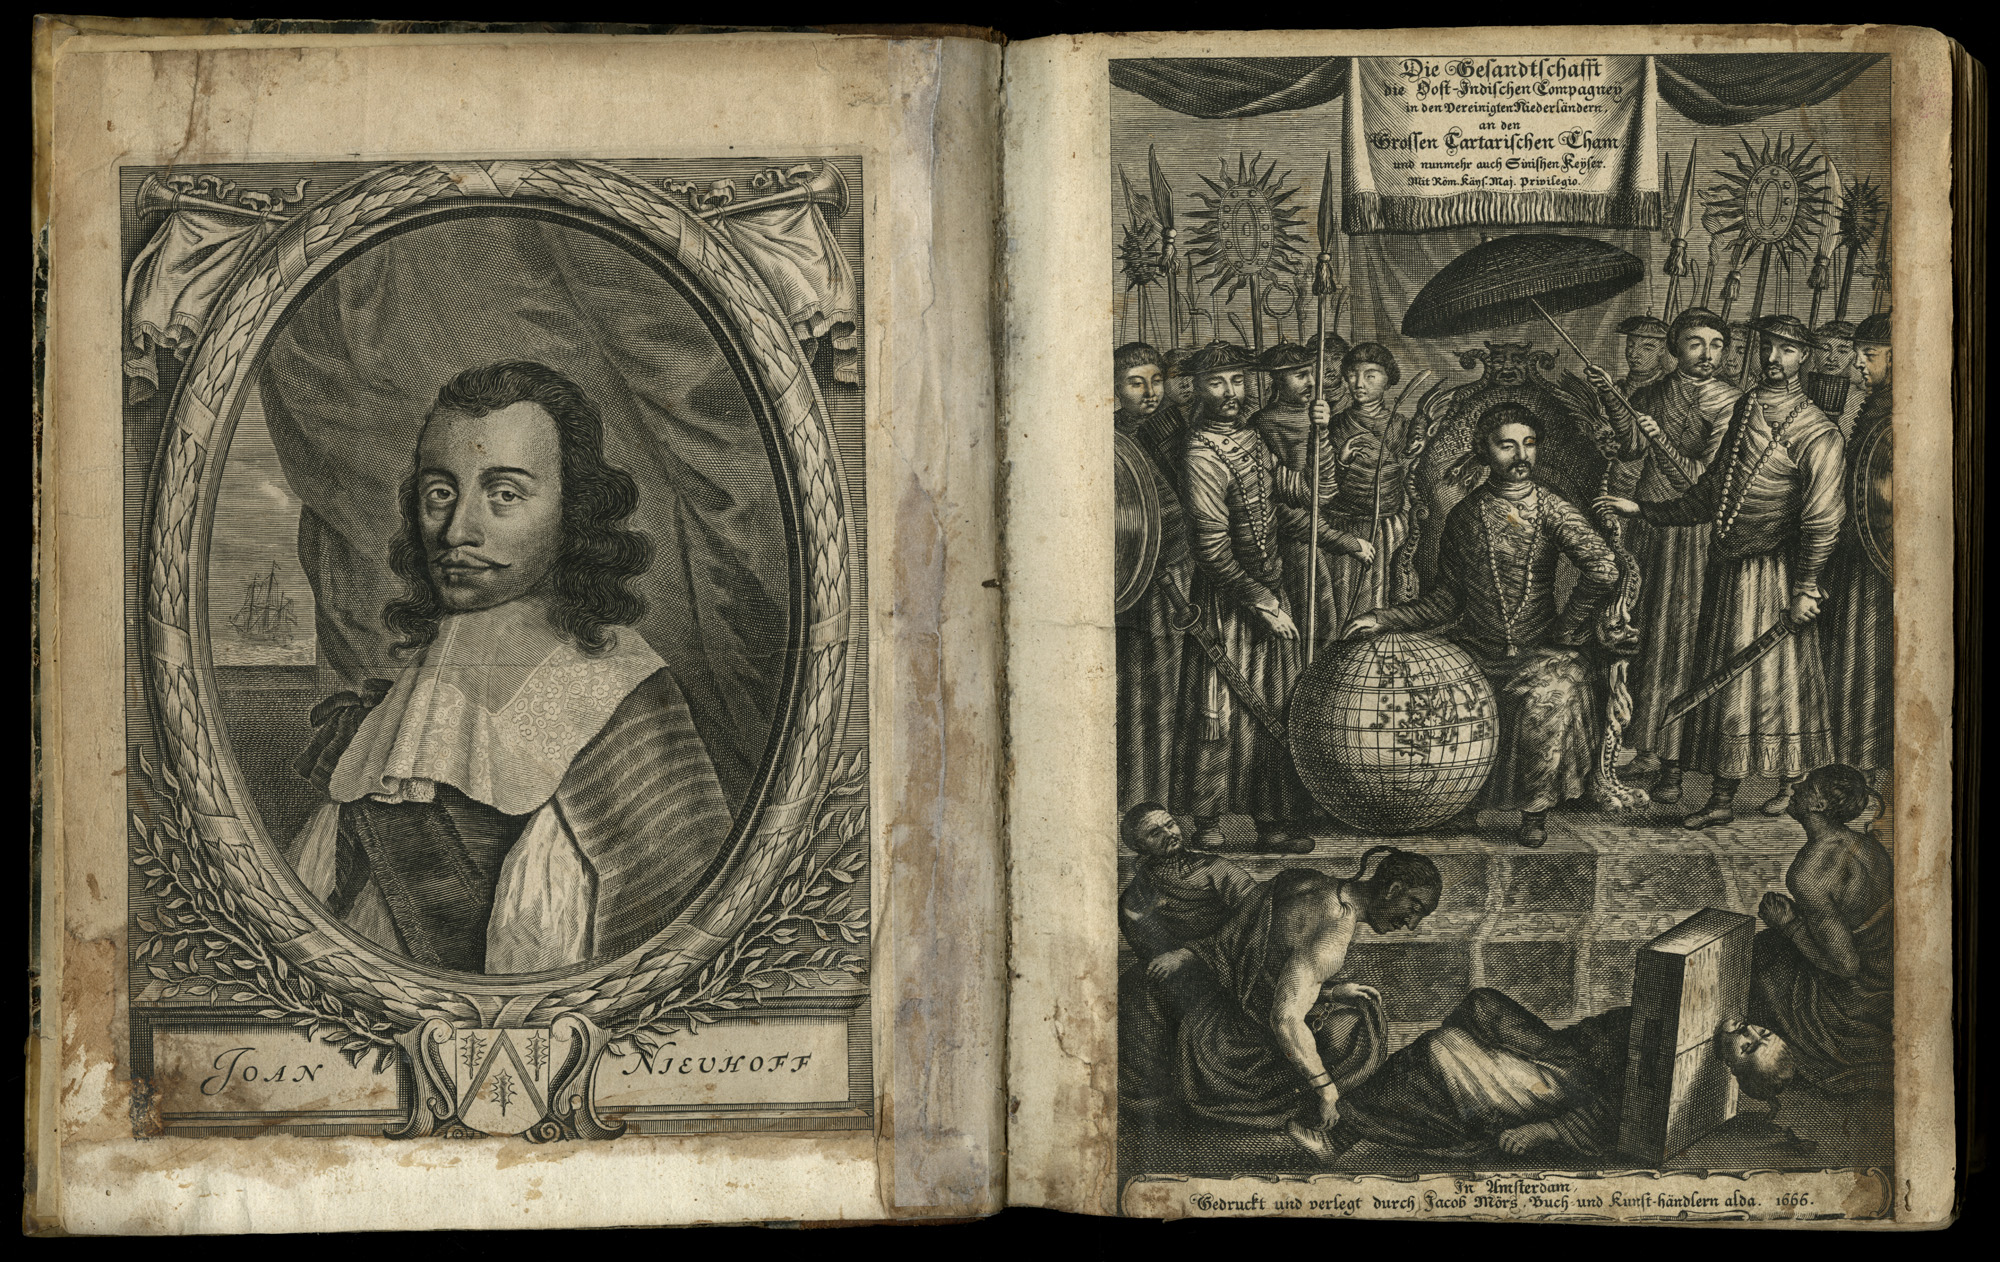
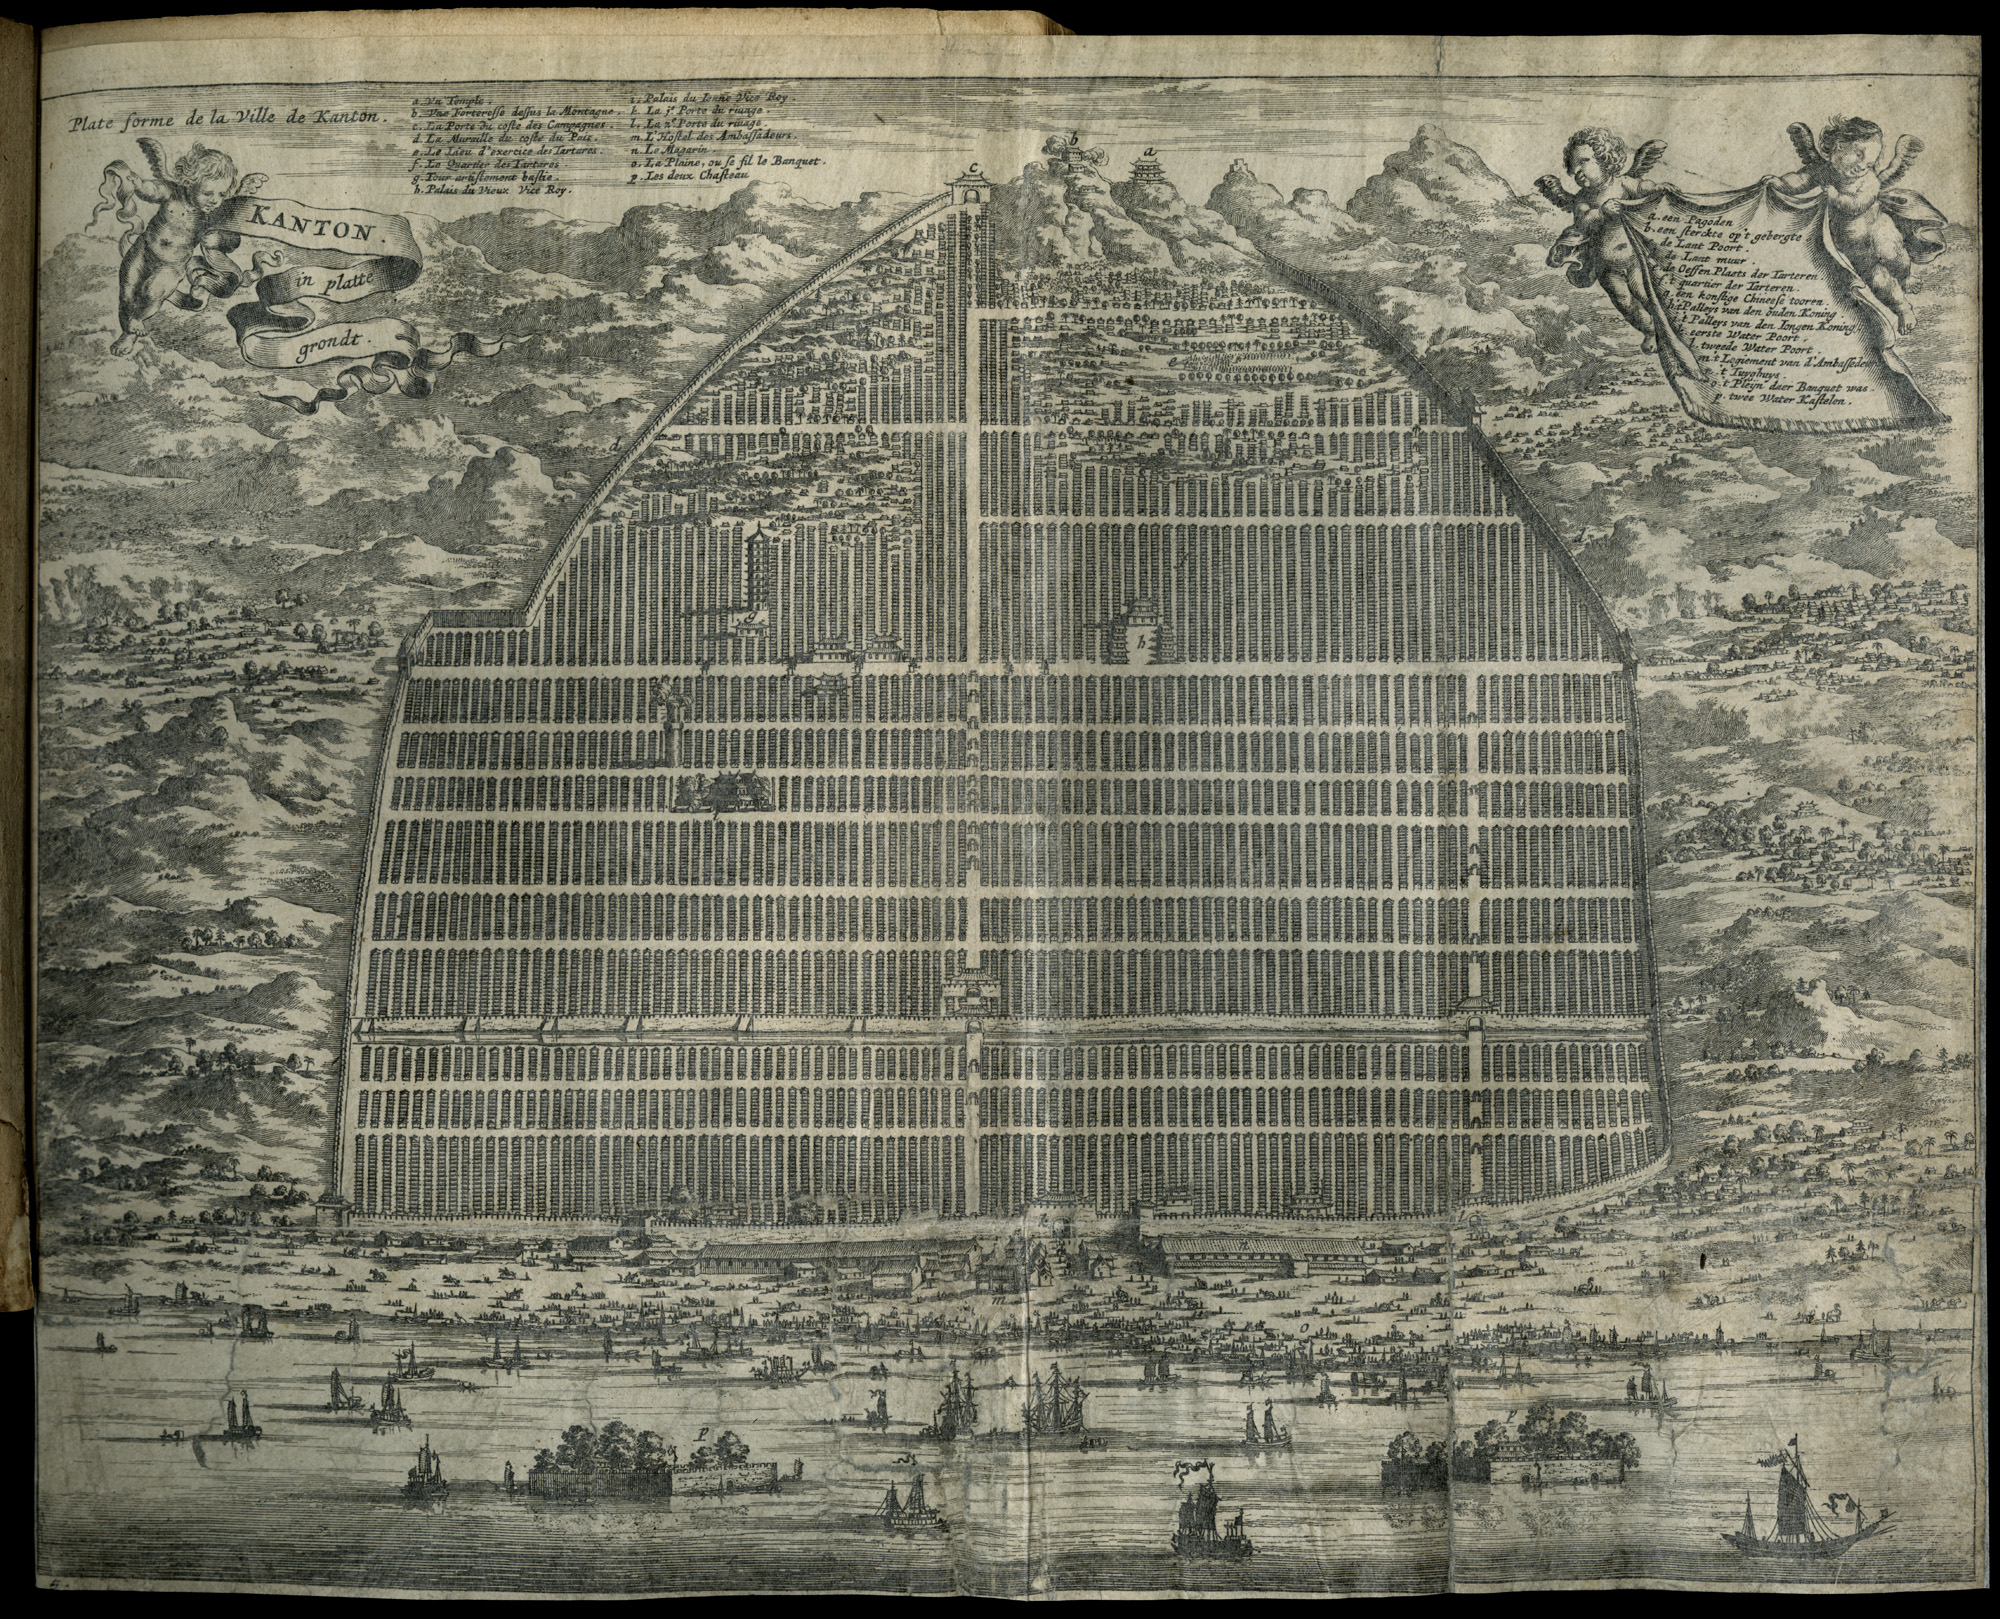
By the 1400s and 1500s growing economic activity within cities and trading networks began to surpass that of land-bound feudal systems, challenging their power and authority, particularly in coastal parts of what was coming to be known as Europe. Some landed feudal authorities, such as the rulers of the Iberian kingdoms of Castile and Aragon, worked to take control of as much of this growing maritime activity as possible; The result would come to be known as the Spanish Empire. In other areas, particularly the urbanized Netherlands, with its increasingly powerful merchant classes, overseas trading endeavors took on a more explicitly commercial character. Such endeavors were dominated by organizations such as the East India Company.

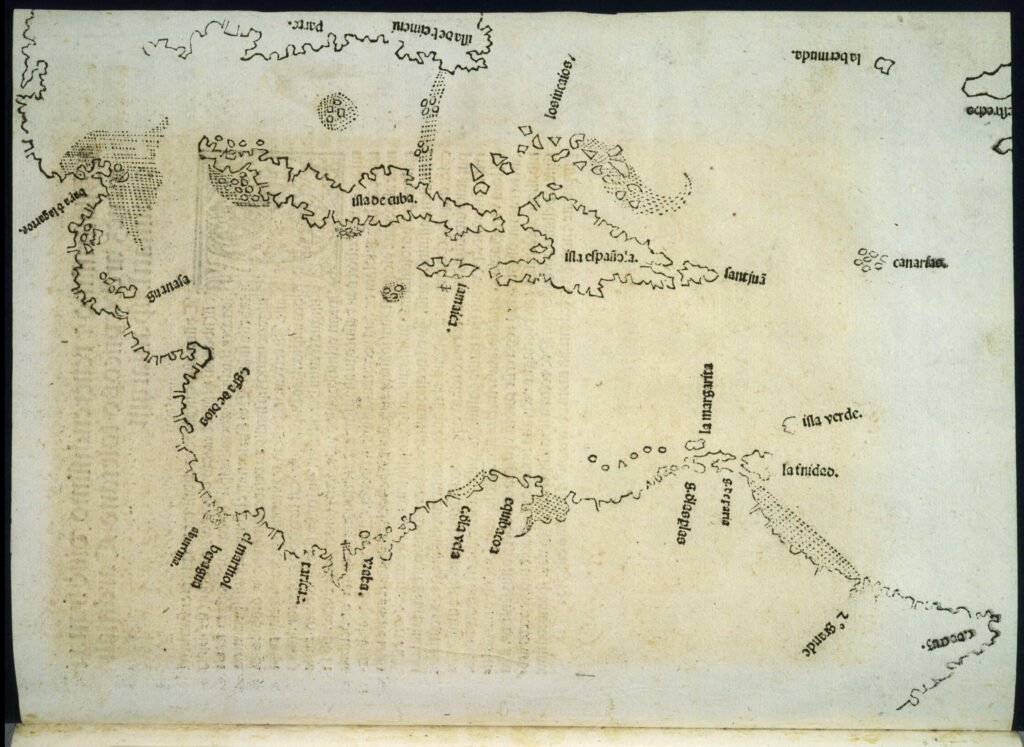
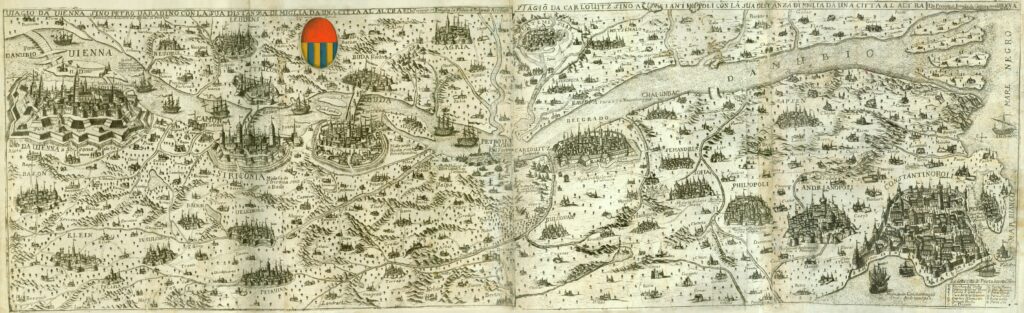
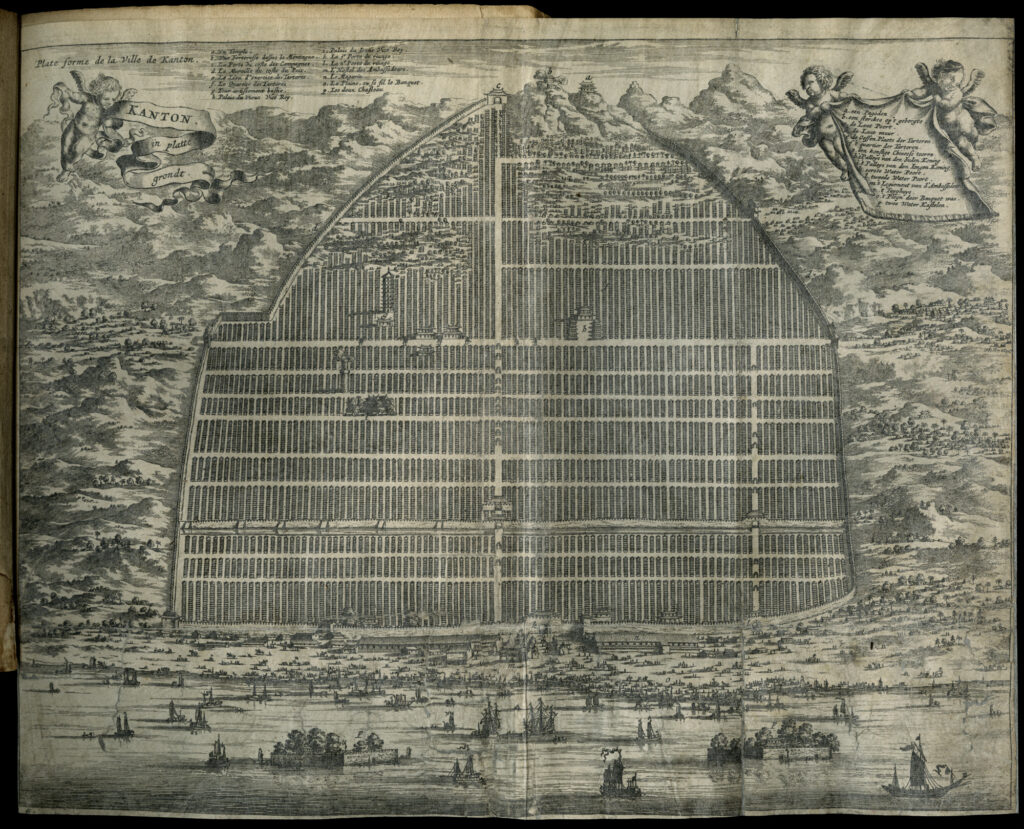
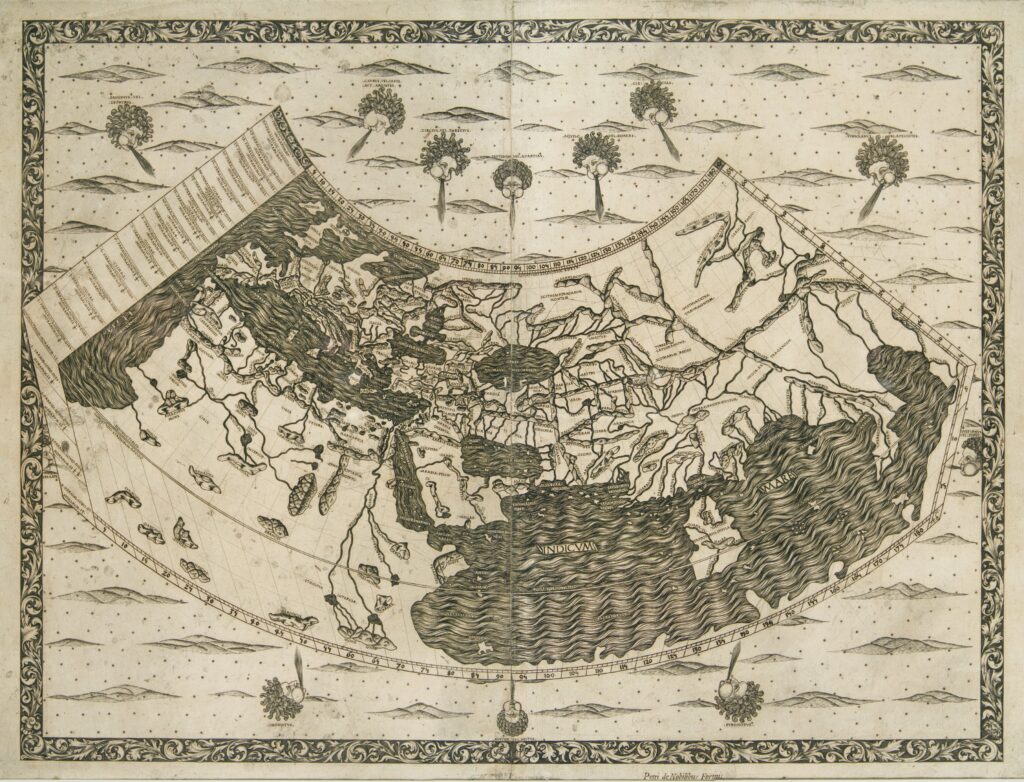
A 1511 map by Peter Martyr d’Anghiera may have been among the first to communicate to the Spanish Crown that their hired explorer, Christopher Columbus, had not indeed reached the “India” of his imagination, but nearer lands that would come be known to Europeans as the Americas. Here he represented European knowledge of their coastlines, such as it was at the time. A map drawn in Venice a few decades later illustrated a long-developed region of cultural and economic exchange along the Danube River. This map showed not a Europe of territorial boundaries, but a network of influential cities, from Vienna in the west to Constantinople in the east. An explicitly urban map representing the Chinese port of Canton accompanied the Dutch East India Company’s 1666 charter. In this case the company sought to raise investment capital in Europe to profit from trade in wealthy eastern cities like Canton. Promotional maps such as this sought to emphasize their prosperity, and the prospect of getting a piece of it.
Questions to Consider
The “world as we know it” has changed much over time, both on the ground, and in the ways humans have claimed to know it. While all cultures around the world have had some idea of “world,” the forms they have given it have ranged from symbolic to geometric, from ideological to empirical, and from highly generalized to meticulously detailed.

The notion of a spherical world has been common to many cultures, though in most cases this sphericity has been more symbolic than empirical. While navigational instruments around the world had long demonstrated some knowledge of the solar system, geometricians along the shores of the ancient Mediterranean were among the earliest to visualize the earth’s curvature in maps, and to calculate its arc using complex geometry. In the second century CE an Alexandrian named Claudius Ptolemy compiled these maps and related commentary in a work he called The Geography, a work which would remain in practical use for well over a millennium. Translated into Arabic, Latin, and other languages, Ptolemy’s Geography was still in sufficiently widespread use that it was among Christopher Columbus’s key geographical resources, and continued to merit reprinting well into the sixteenth century, as this map from 1560 suggests.

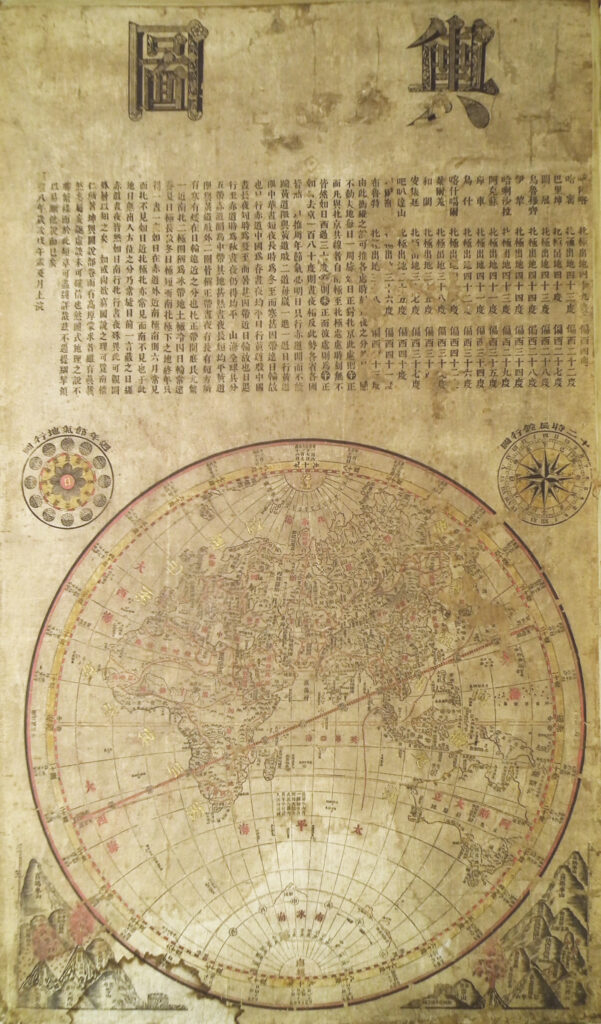
Detailed land maps in East Asia had employed geometrical grids for many centuries, a cartographic convention which worked well for the land-based economics and political administration of successive Chinese dynasties. Maps printed in China in most cases only began to account for the curvature of the earth in recent centuries, when European influences began to make inroads into local ways of seeing the world. Zhuang Tingfu’s 1858 Map of the World contains much information specific to its Imperial Chinese context, but adopted a hemispheric view and prioritized territorial information, two practices more common in mid-nineteenth century Europe—with worldviews dominated by maritime trade and naval supremacy—than elsewhere.
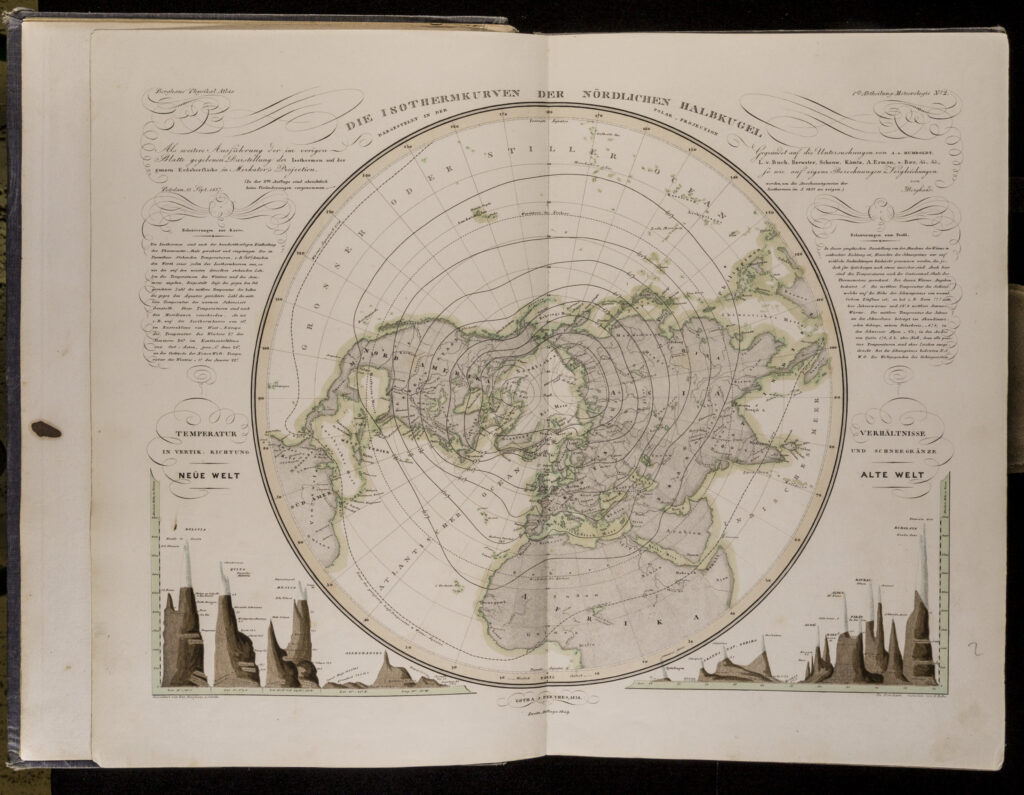
Like Ptolemy, Alexander von Humboldt, a geographer at the University of Berlin in the early nineteenth century, sought to compile human knowledge of the earth in a useful format. Humboldt, however, understood geographical knowledge not as a compilation of facts and descriptions, but as a reasoning process that engaged and challenged the reader. He devised a series of atlases to encourage readers to adopt this style of reasoning, including the volume this map is taken from, printed in Berlin in the 1840s by Heinrich Berghaus. Isotherms, represented here in lines, represent temperature norms at various latitudes. When correlated with other surface conditions such as rainfall and elevation, represented on successive pages, it prompted the reader to draw conclusions concerning what sorts of plant and animal life, as well as human population and economy, various regions of the world could support.
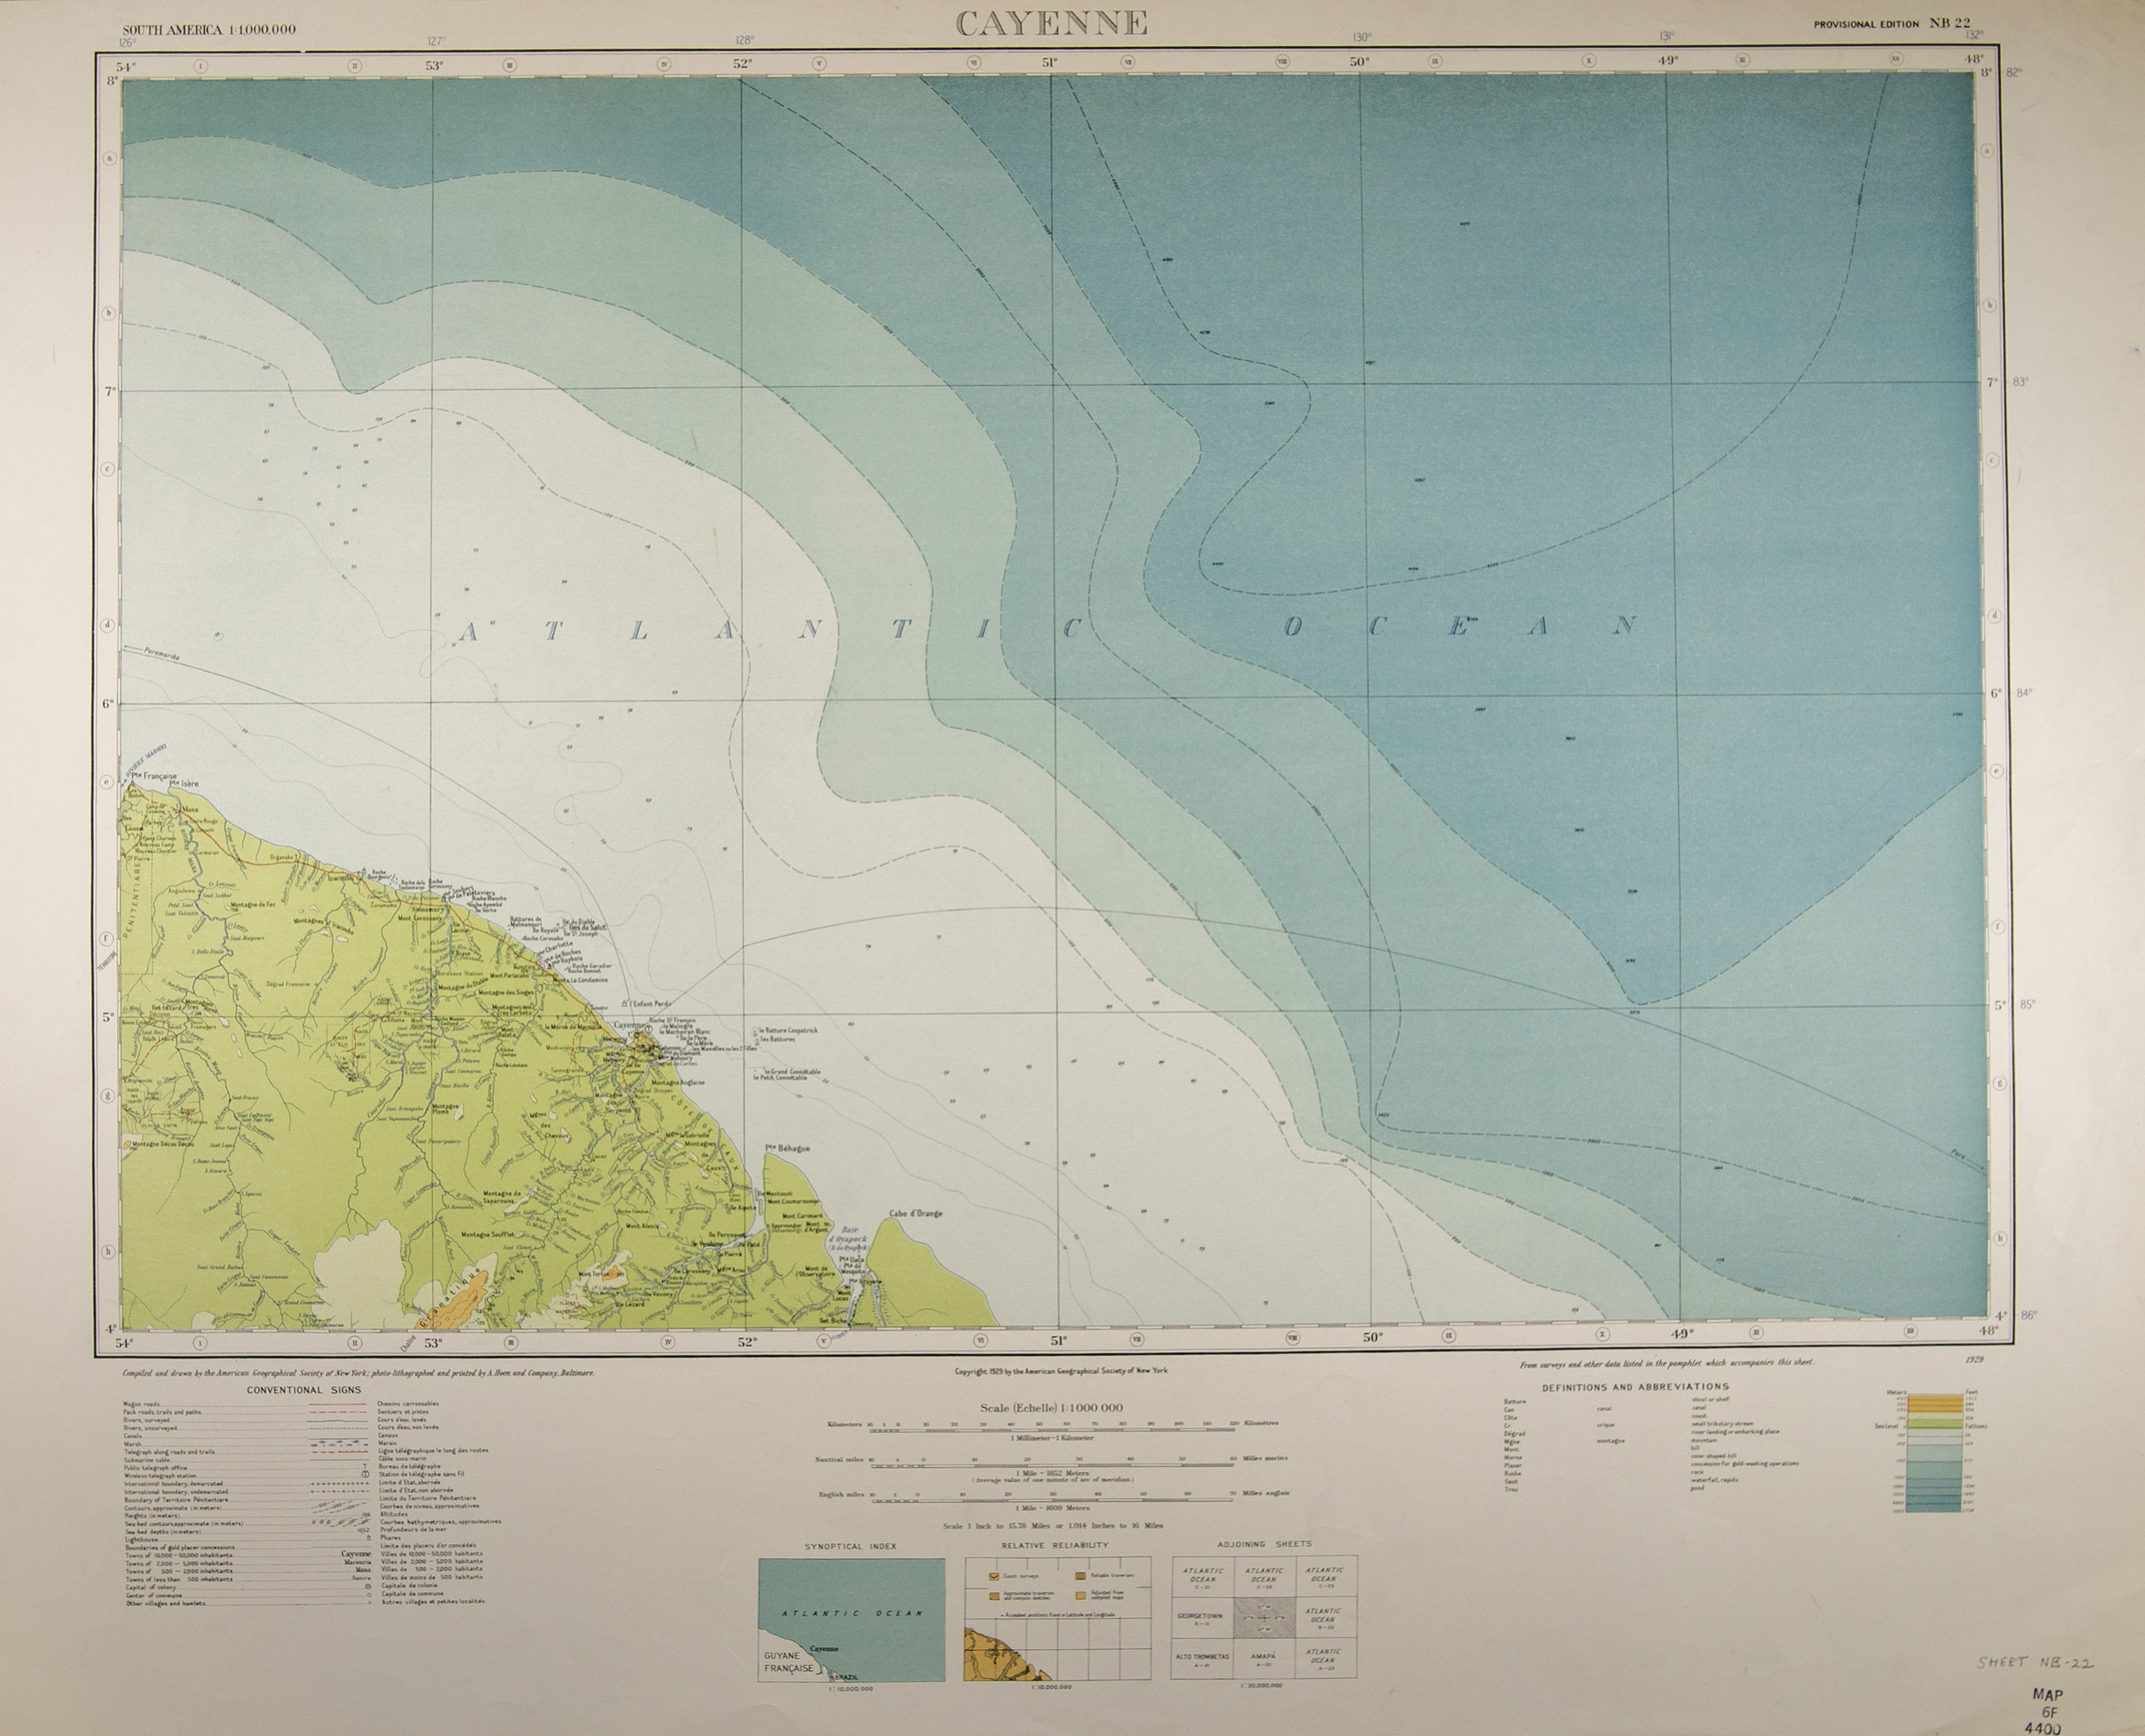
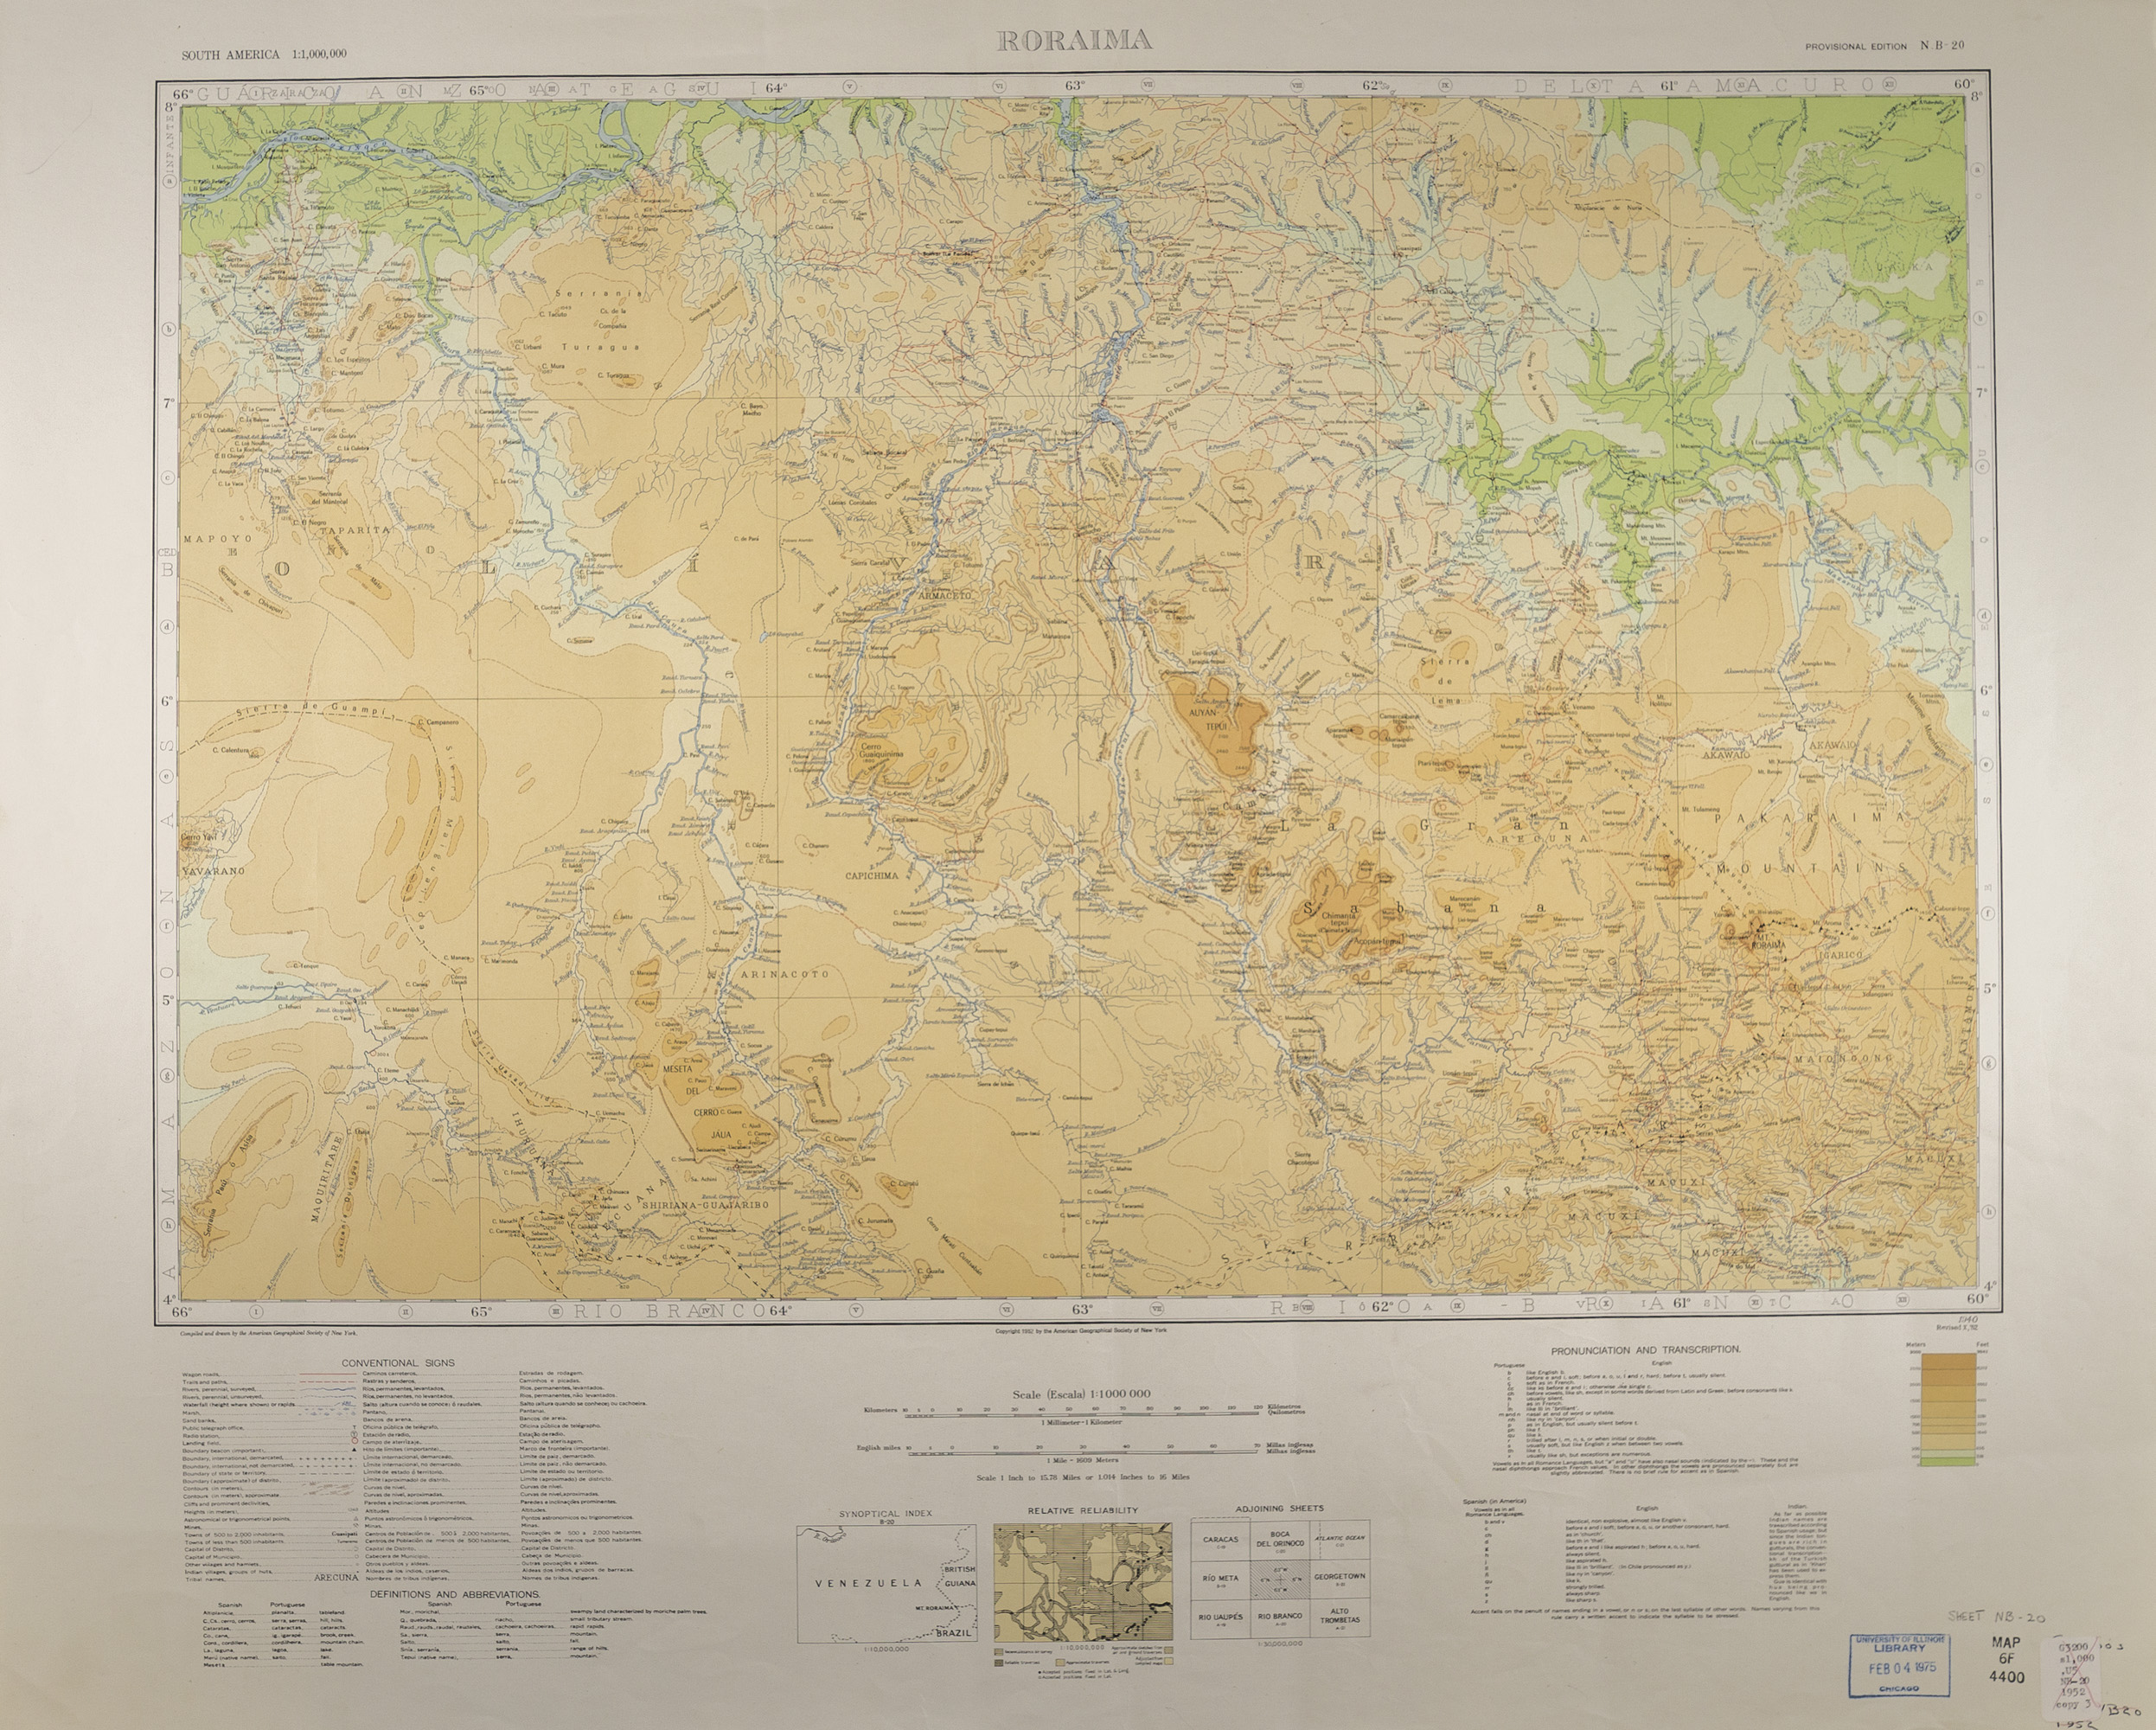
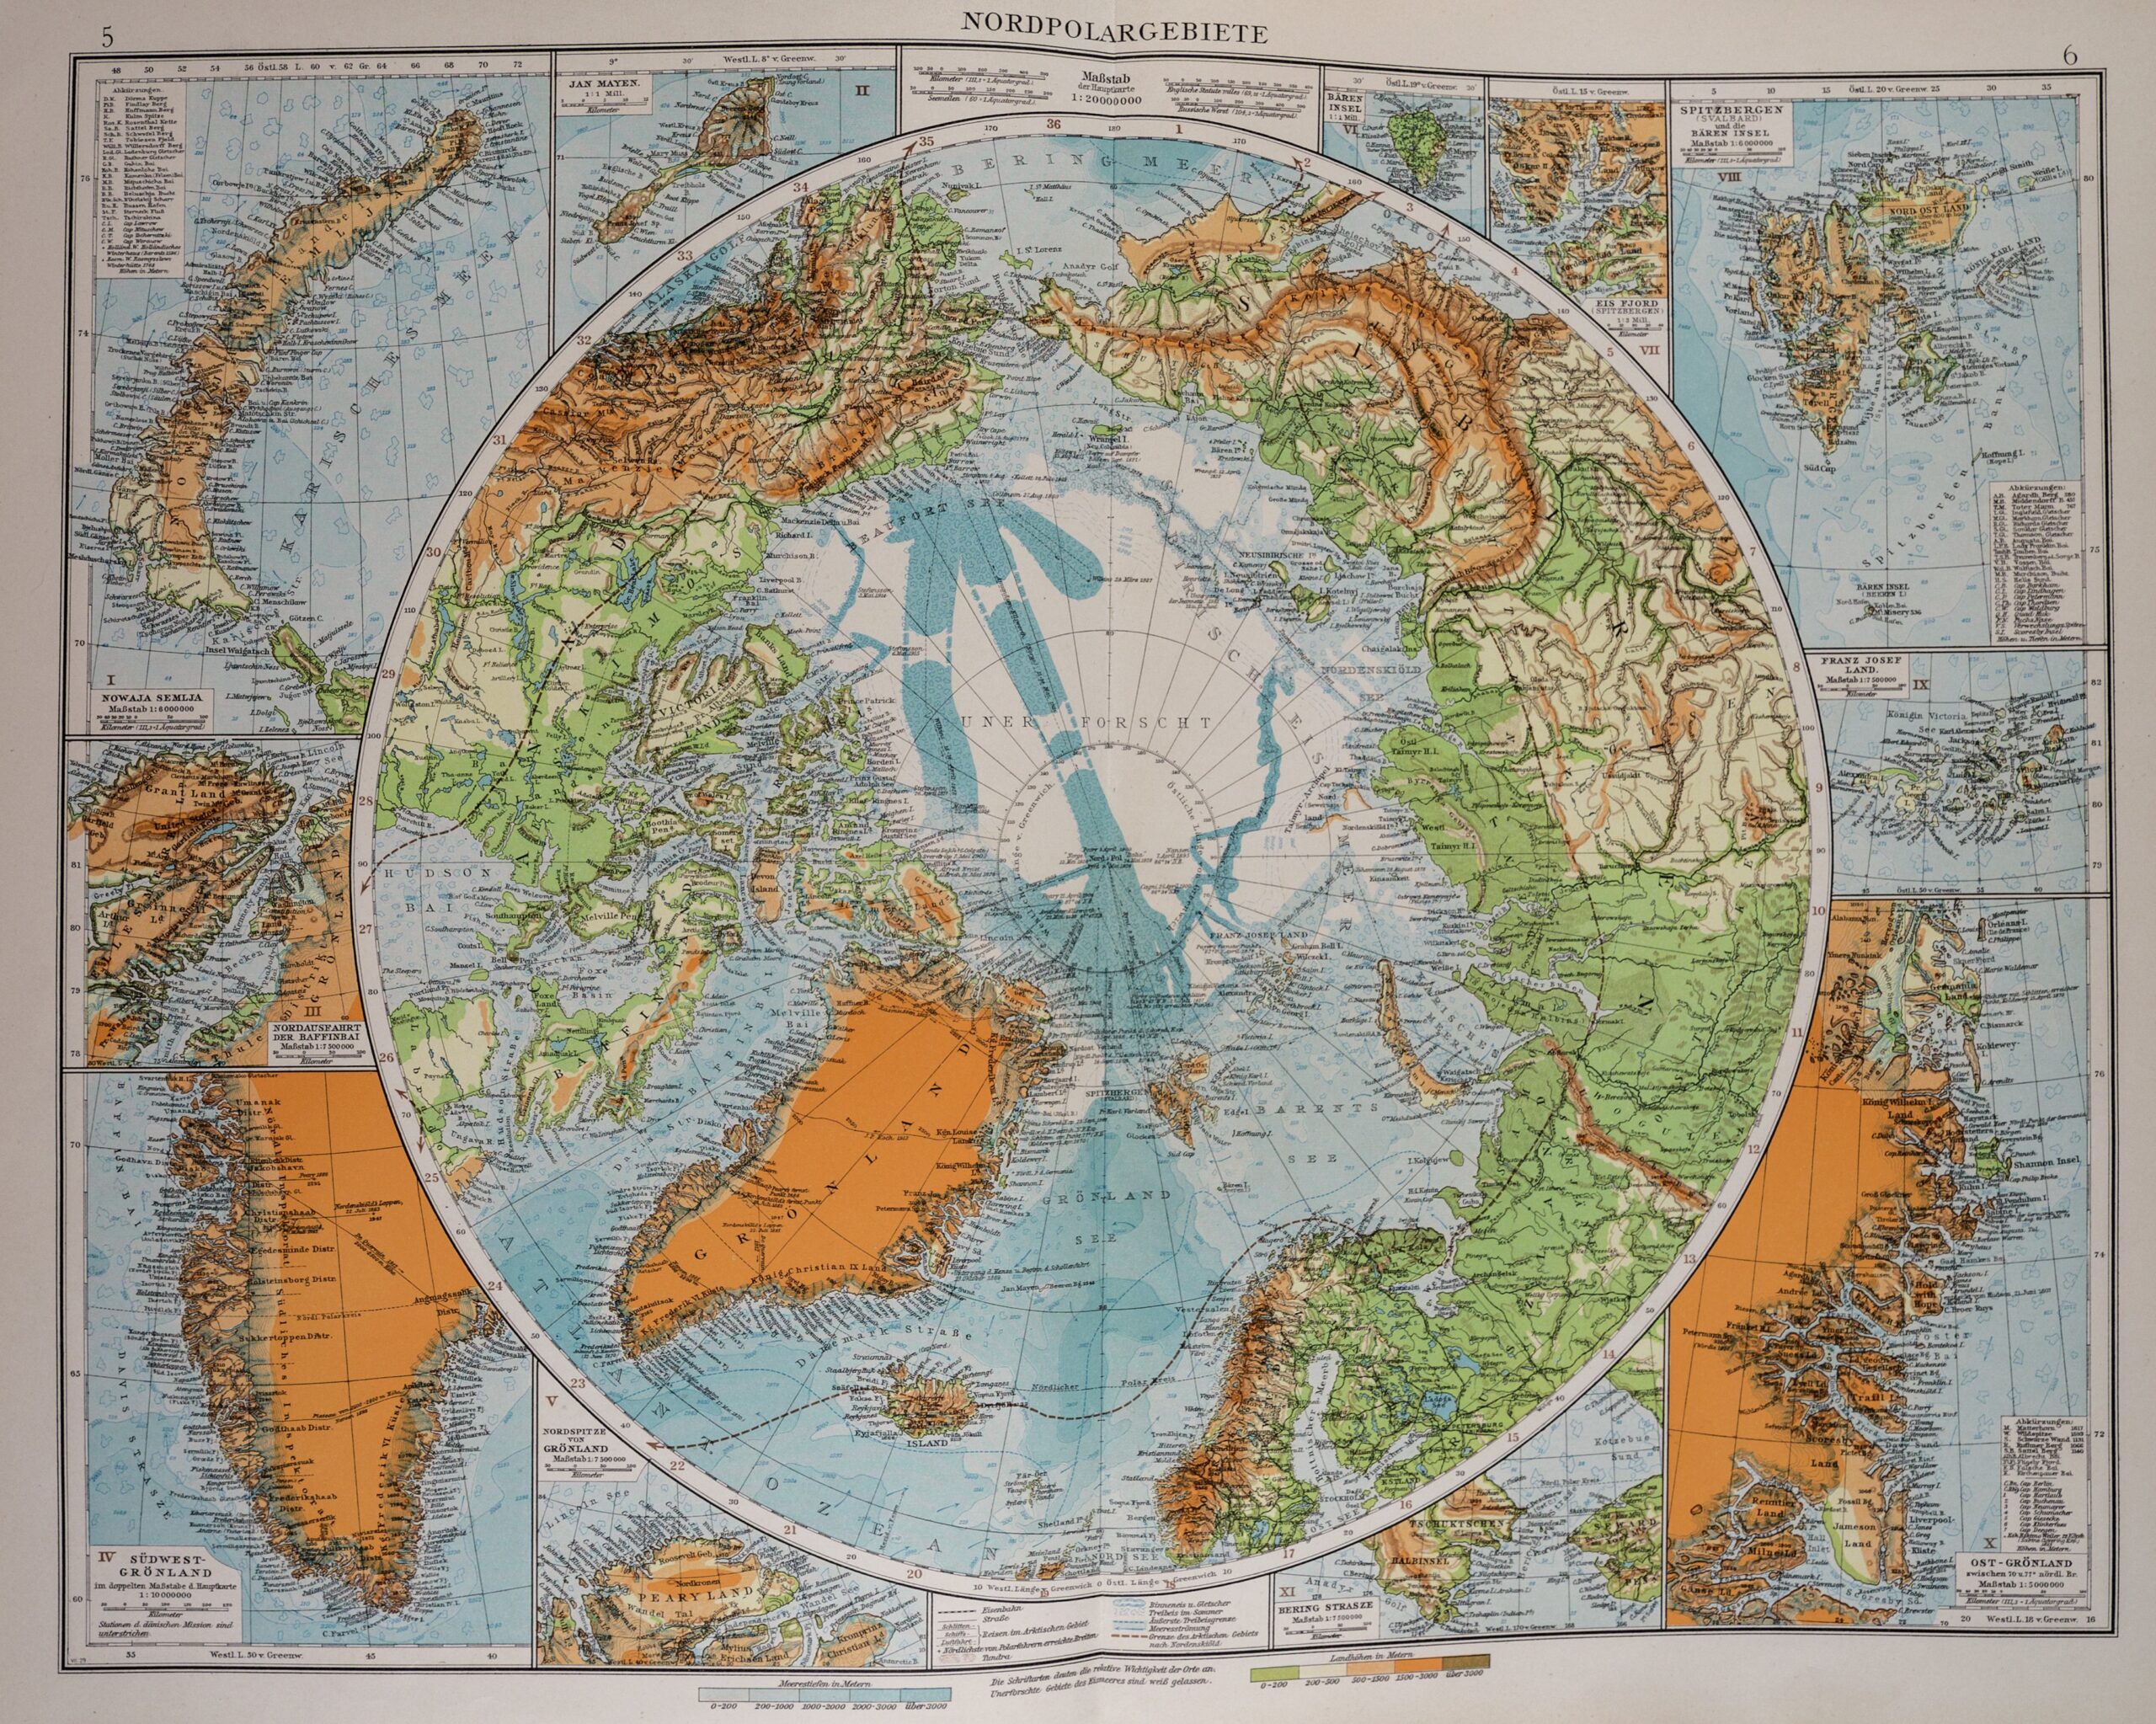
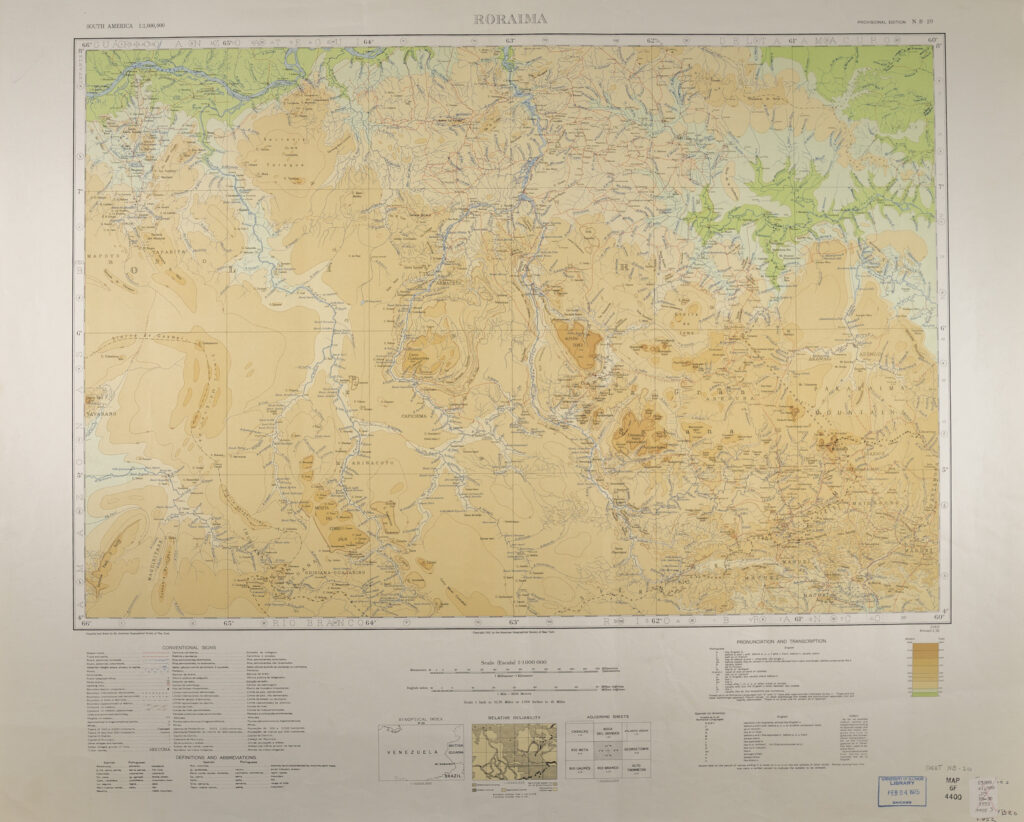
It was not until the early twentieth century that geographers and government around the world finally agreed on consistent global mapping and measuring conventions—and actually began to put them into practice. Among the results of this was the International Map of the World, which represented the world in detail in hundreds of adjoining quadrangles on a one-to-one-millionth scale. These quadrangles contained many local details, from landforms to land uses, but paid little or no attention to territorial claims, border, and boundaries. It took decades to complete, and made possible globally-coordinated aviation and shipping as well as globally-organized economic, infrastructure, and human development programs, particularly after the establishment of the United Nations in 1945, which took over administration of the IMW not long after.
Questions to Consider
In an article considering Indigenous North American mapping practices and their selective adoption by Europeans traveling across and settling on the continent, Barbara Belyea has noted that “Not all maps, not even all European maps conform to the Ptolemaic system of spatial coordinates on which modern topographical sheets and GIS mapping are based. … The notion of error, like that of scale, is conventional and culture-specific. We do not see with the naked eye; instead we see what we are trained to look for.” (Belyea, pp. 141-142)
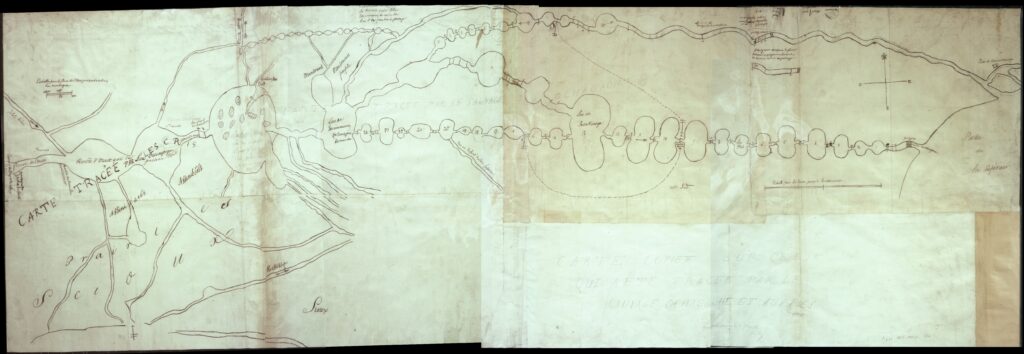
In this case, two maps of the same area, influenced by different conventions, illustrate very different representation strategies. Both very recognizably show distinct sorts of attention to geometric abstraction, though only one of these corresponds to a Ptolemaic grid.
The first map shows canoe and portage routes between Lake Superior and the Red River Country to the West. It was attributed to a Cree cartographer named Ochegach by a French traveler named Pierre Gaultier de Varennes, seiur de la Vérendrye. It was drawn for the explicit purpose of navigating this route, and thus contains notes for rapids and portages, but it also excludes other information and context that would have been important to the local Cree and Anishinaabe populations, from whom its information came. Indeed, this version probably contained only the information most useful to Vérendrye himself.

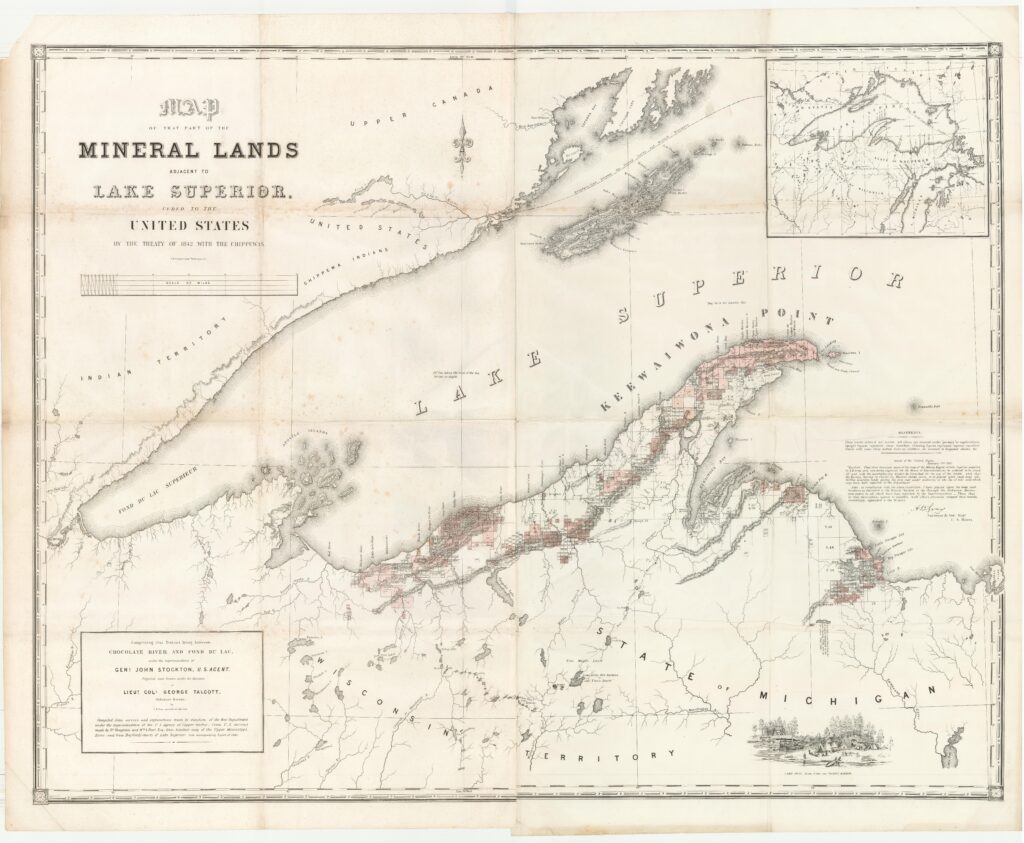
The second map was drawn by employees of the United States Government in the first years following the removal of much of the local Anishinaabe population in order to make way for private copper mining interests. While the US township and range system, based on a modified Ptolemaic grid, had been spreading across farming regions to the south for many decades, the Lake Superior Country’s forested lands had been largely left alone by Euro-Americans until mineral prospectors became interested in the region’s potential wealth. This map showed the grid haphazardly extending north, but only to potential mining regions, where disagreements among claimants demanded government mediation, and that in turn required consistent mapping.

Questions to Consider
The atlas, a compilation of maps arranged to tell a story or convey an argument in their coherence, has been useful for authors interested in presenting world history from a geographical perspective. What that perspective has involved, and the sorts of maps it has employed, has changed much in the past two centuries.
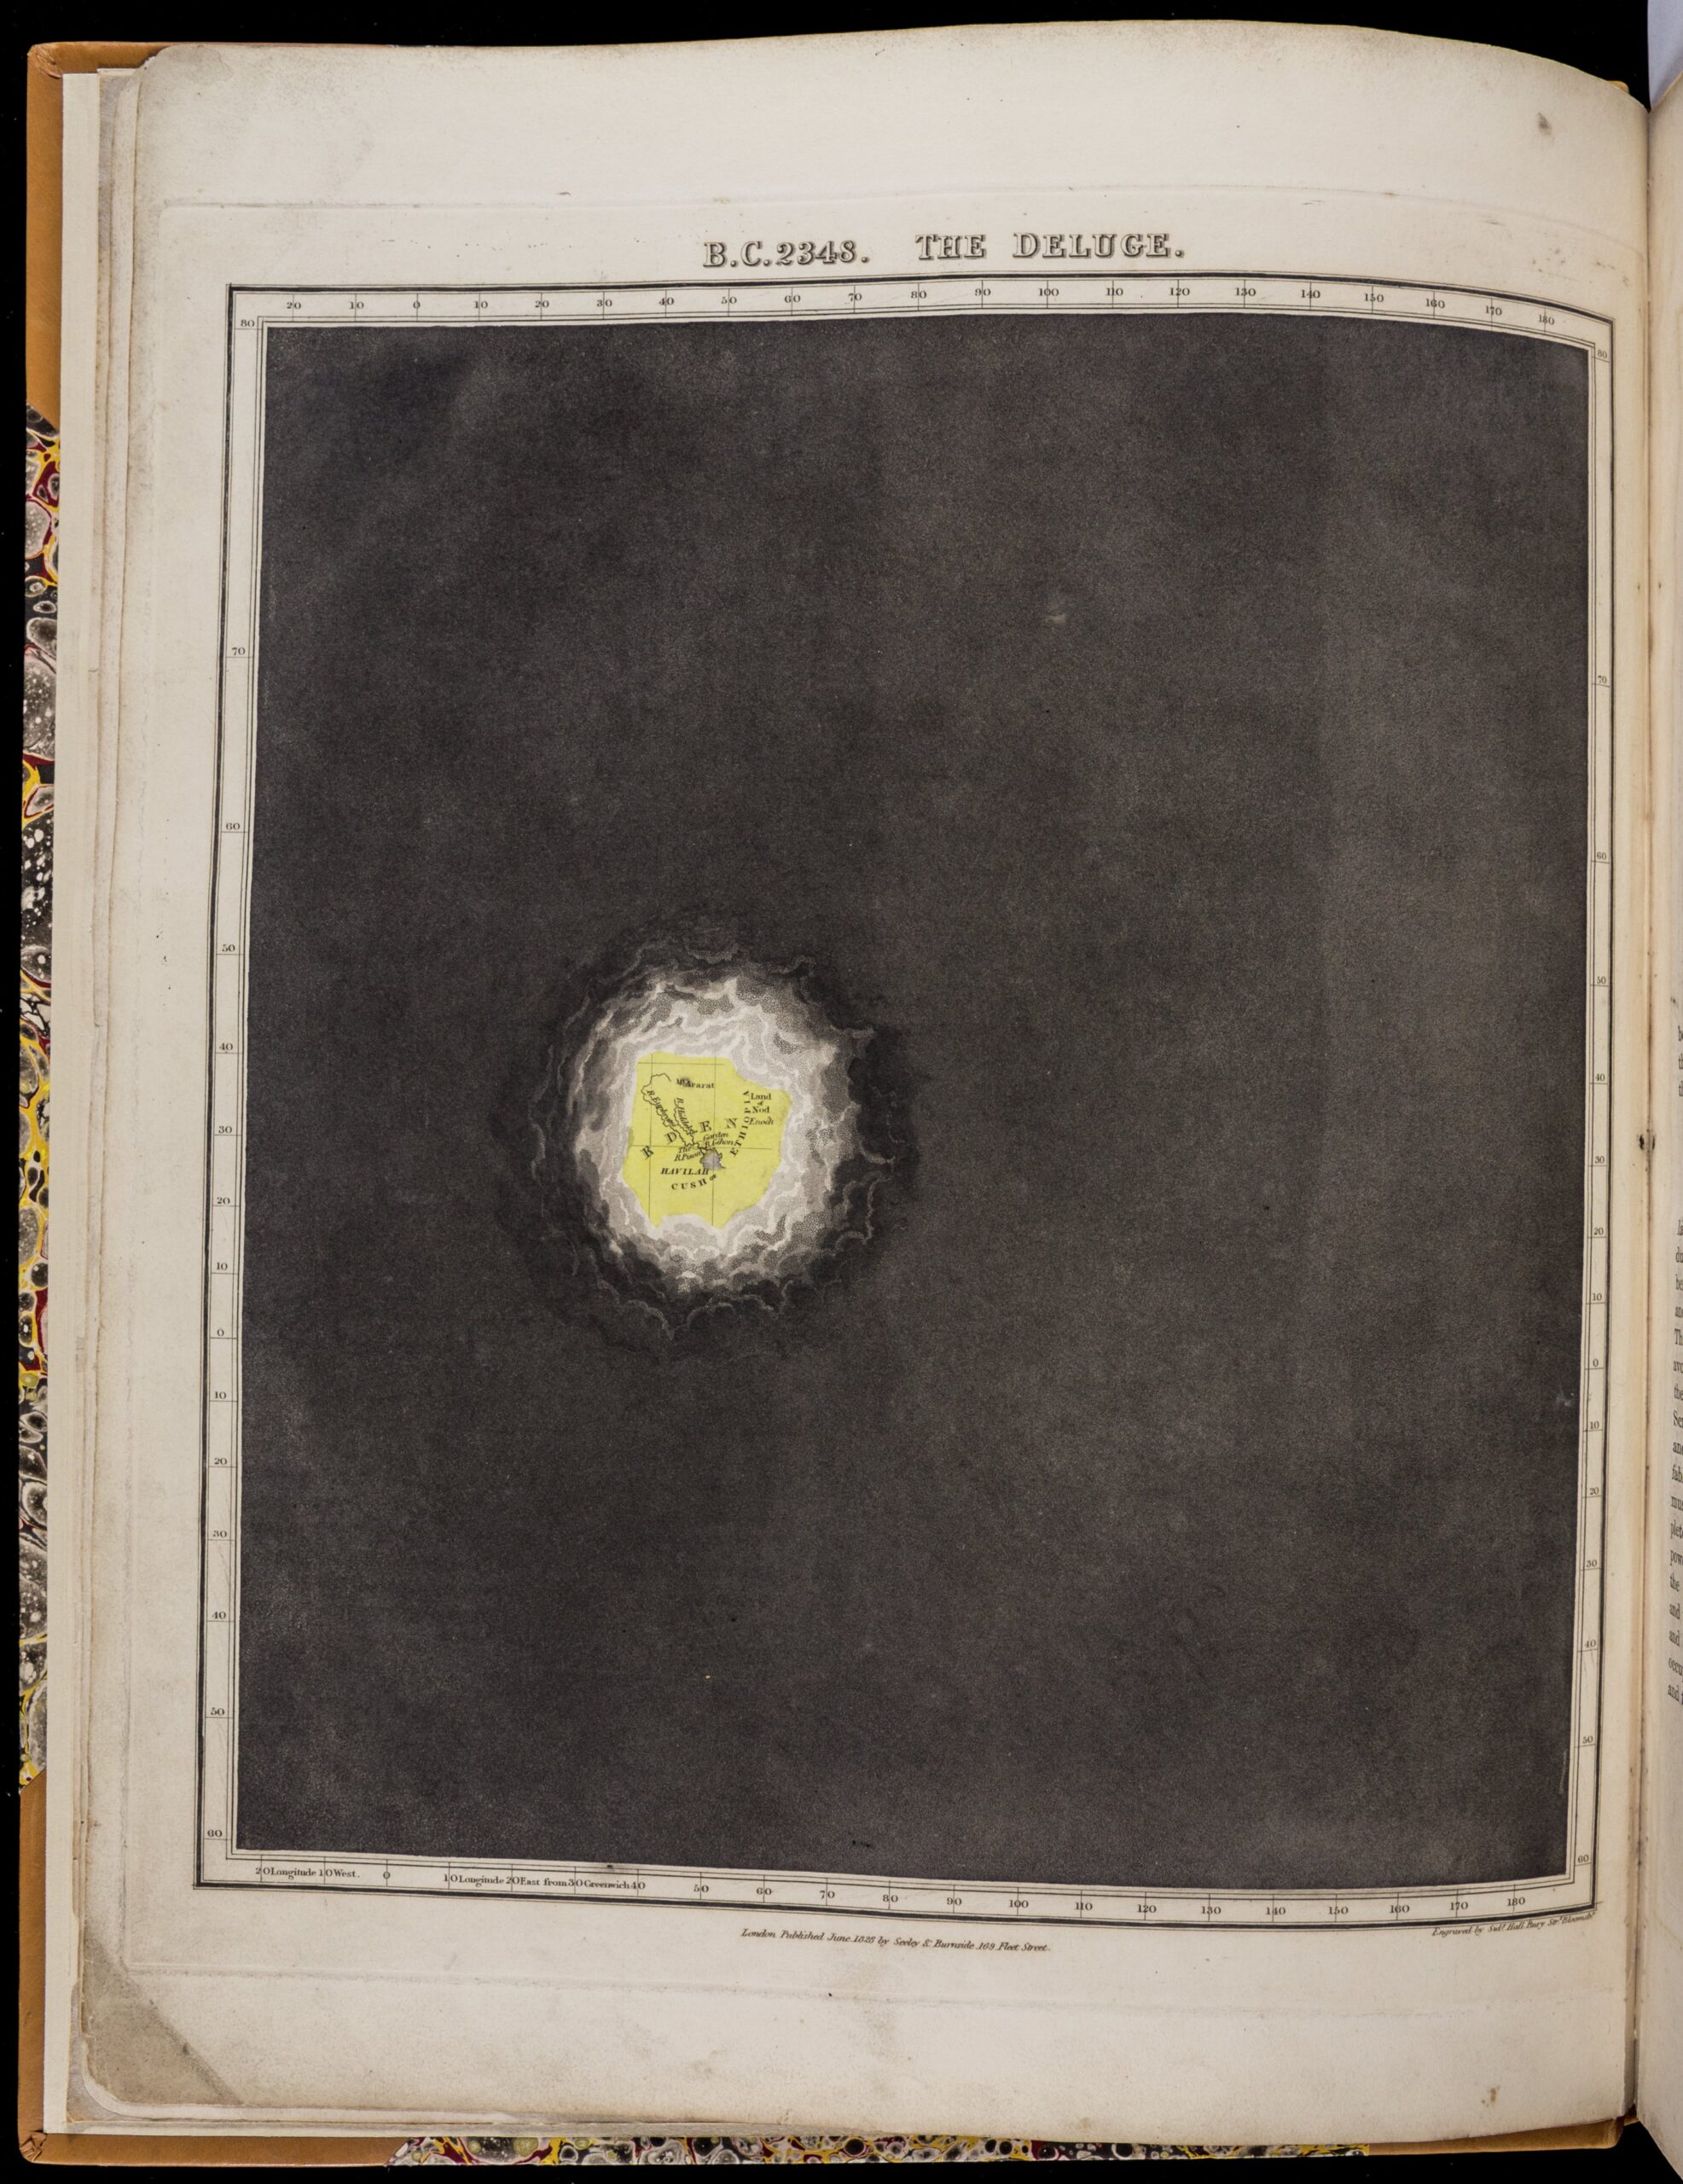
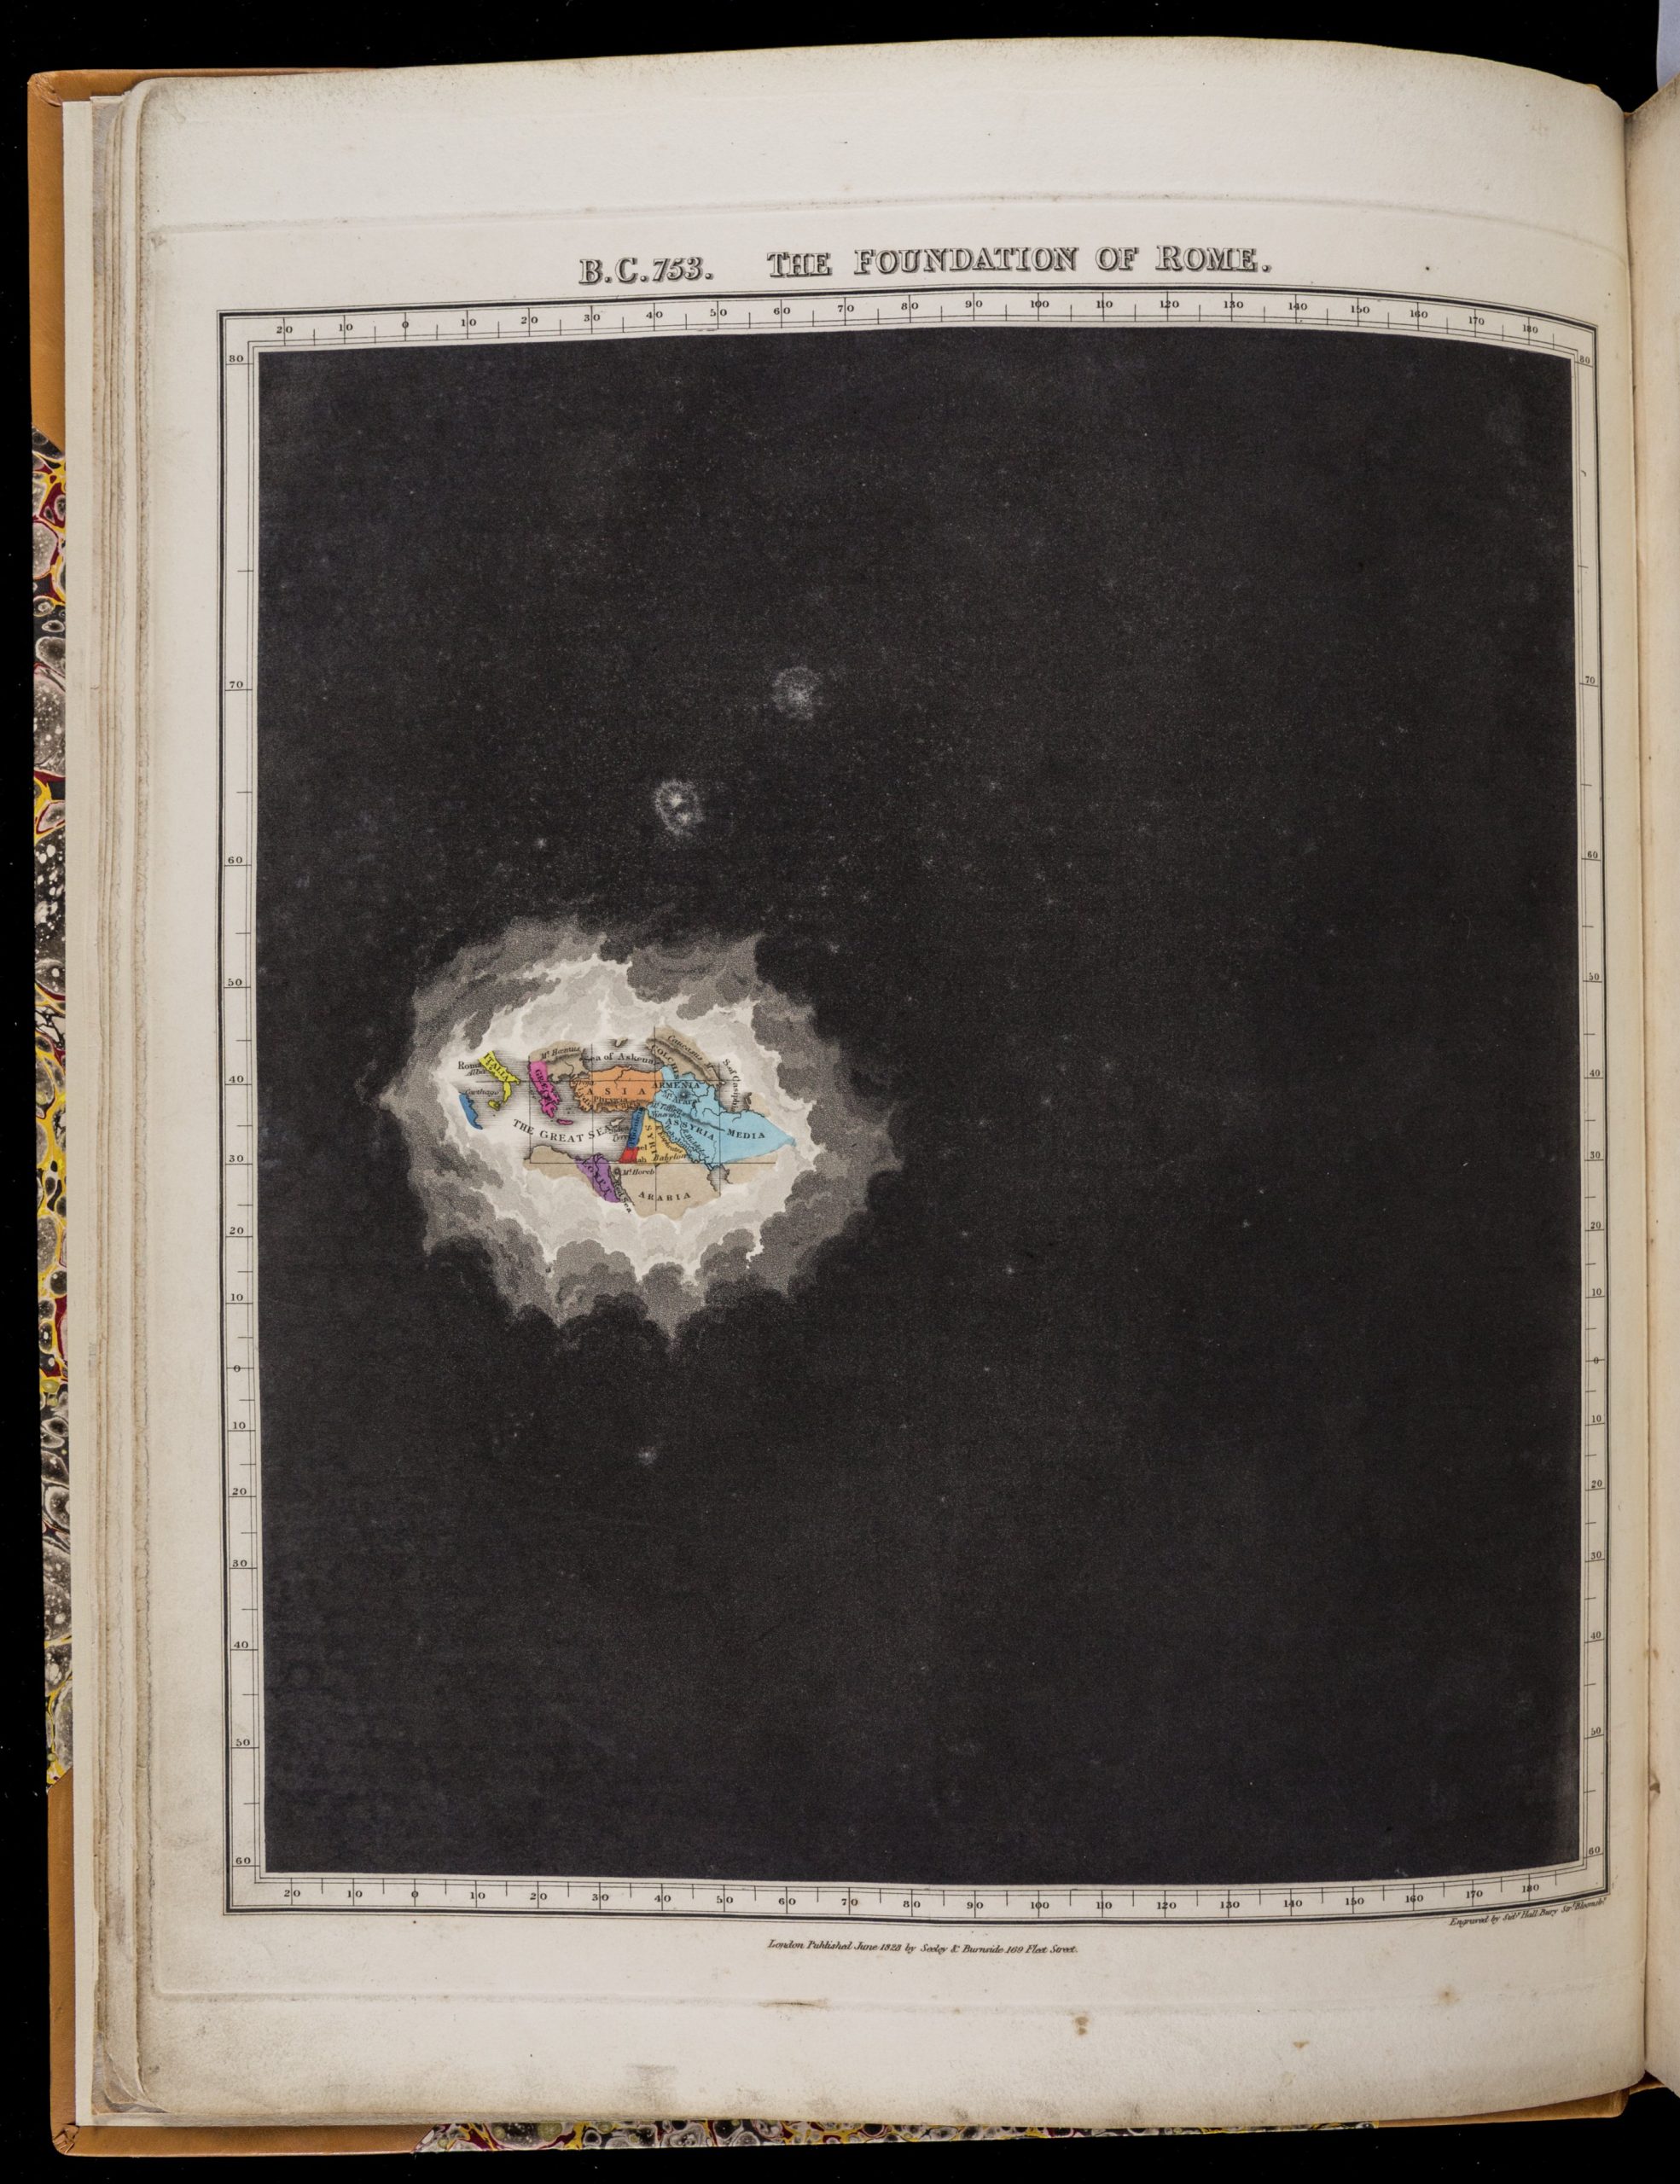
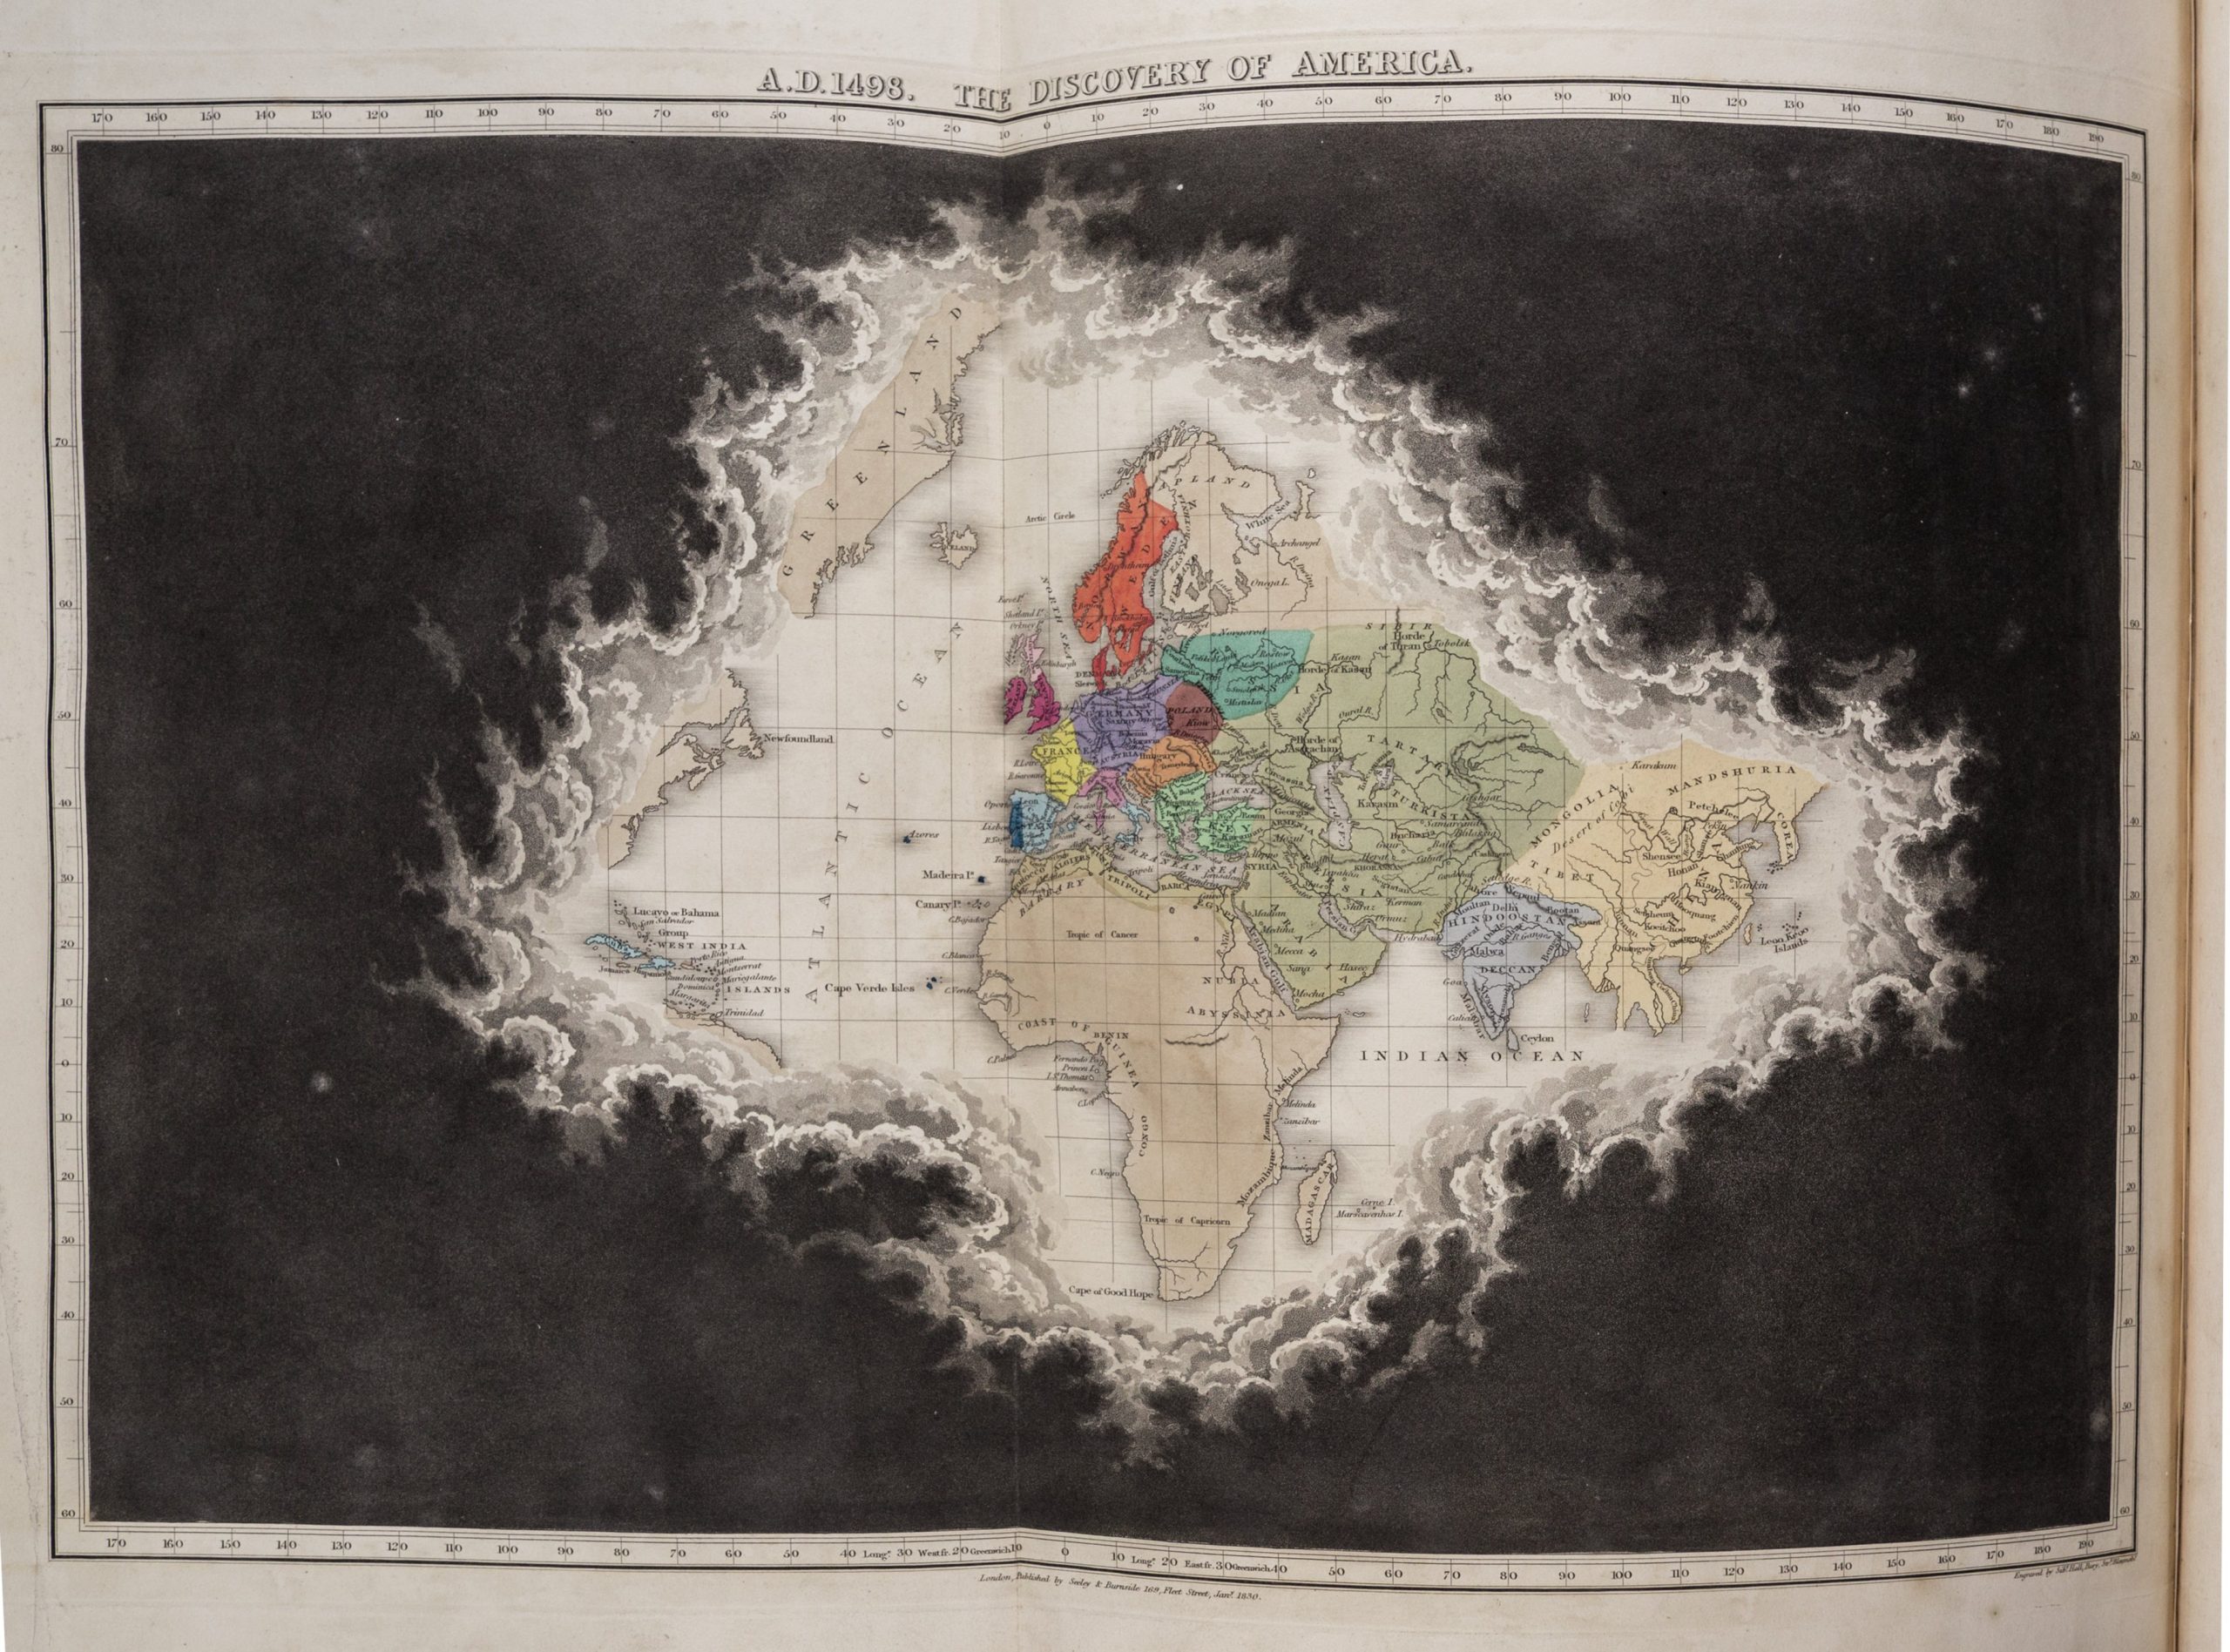
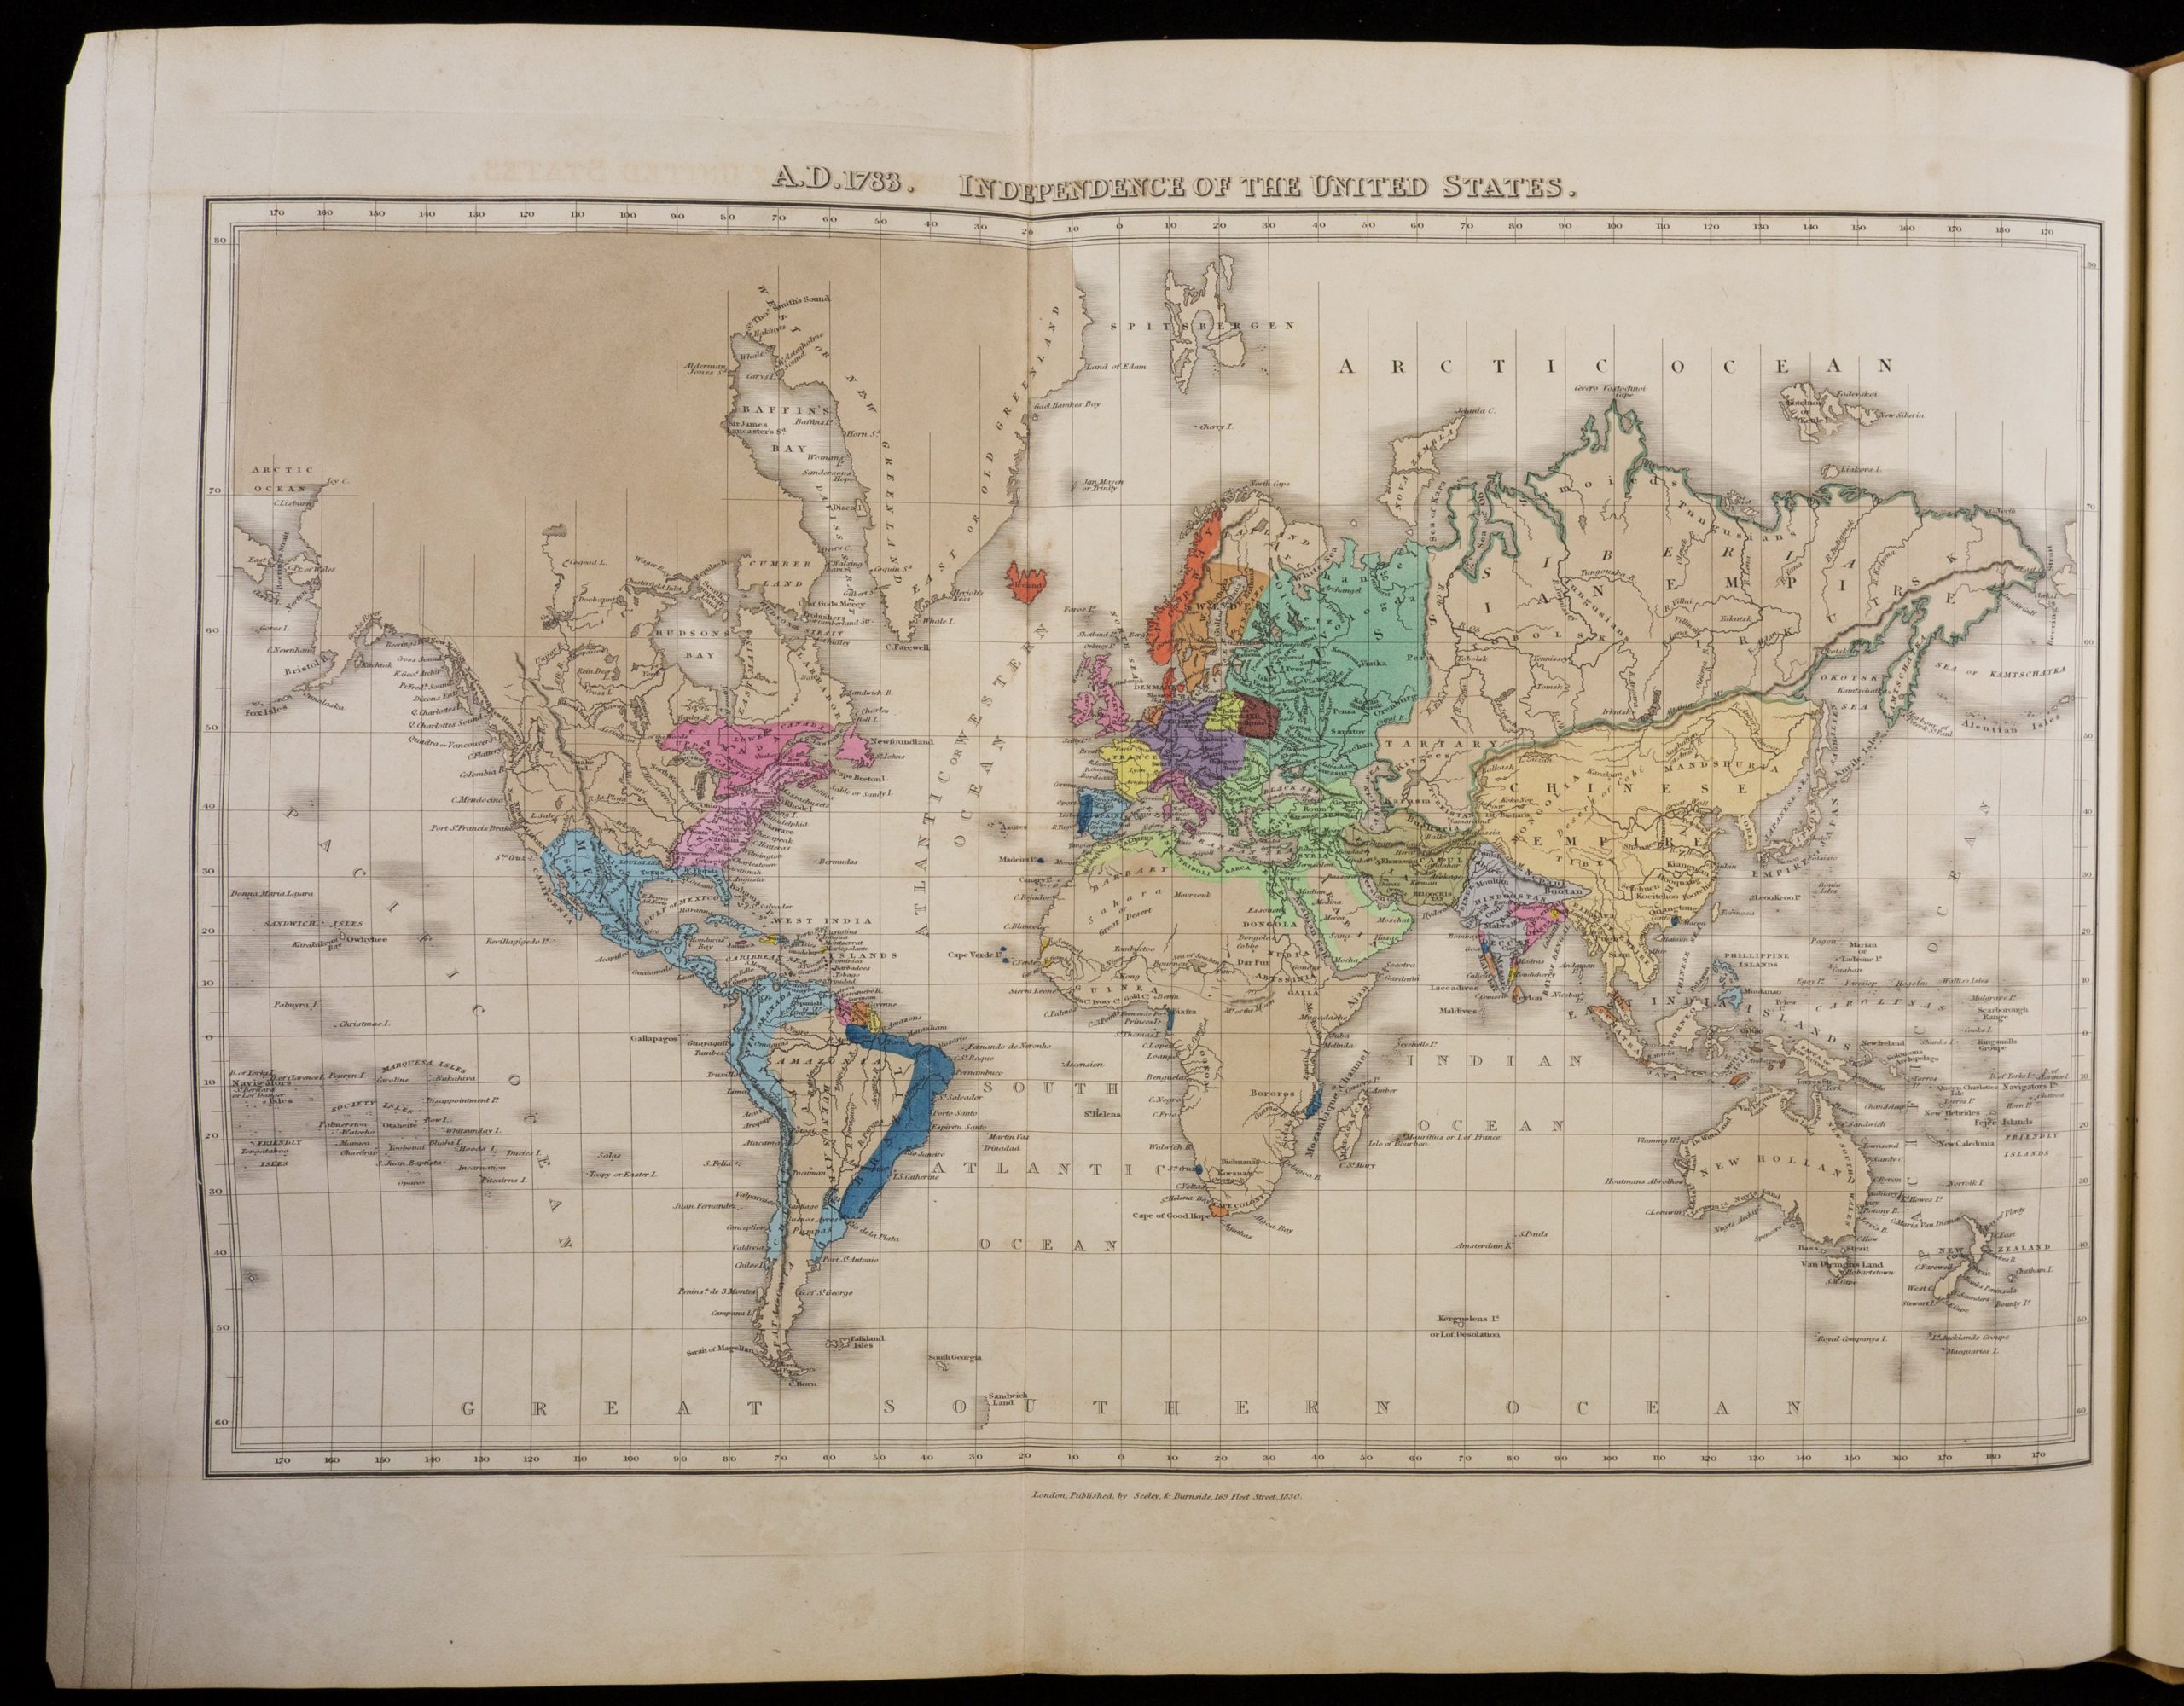
Edward Quin’s Historical Atlas sought to geographically illustrate the development of human civilization in ways that were meaningful to Londoners in the early nineteenth century. As one proceeds through the atlas, dark clouds part to gradually reveal what people at that time and place might have considered “civilized” or “known” parts of the world. Key moments in world history, or, more precisely, moments someone in London around 1830 might have identified as key, in light of that time’s religious or political notions of significance, proceed dramatically in successive pages, each ostensibly doing its part to further banish the dark clouds of barbarism from the earth.
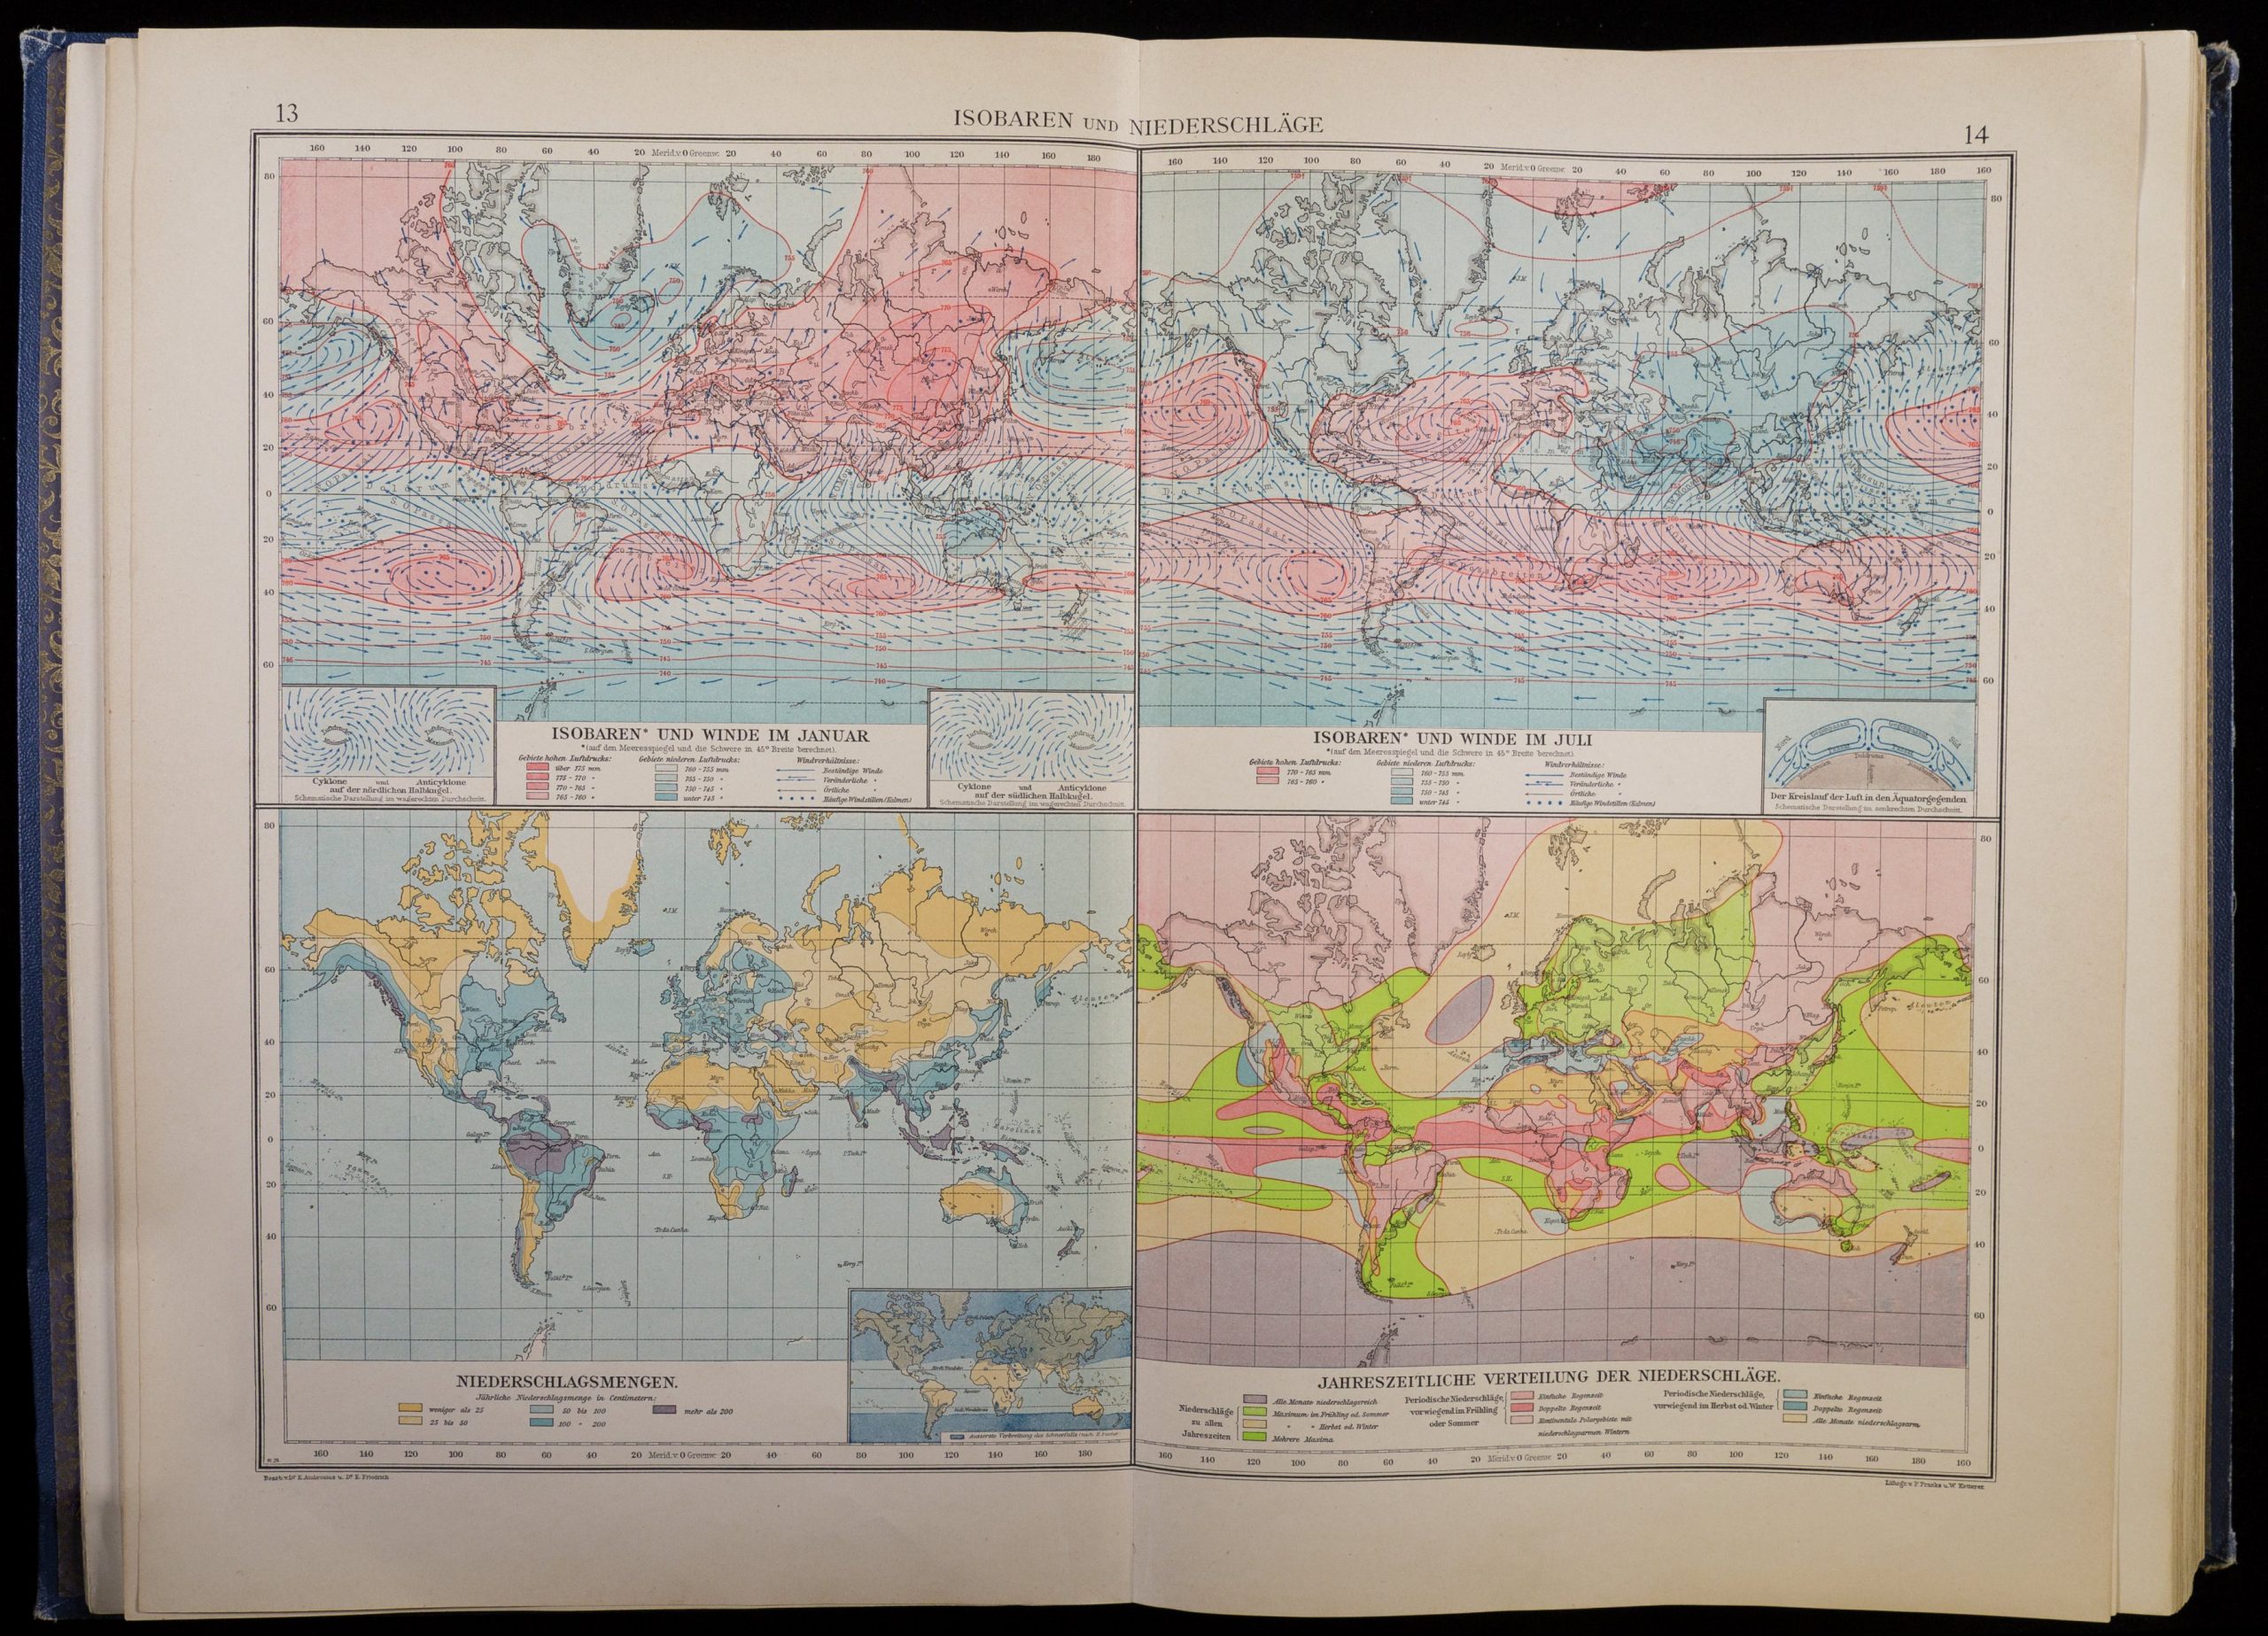
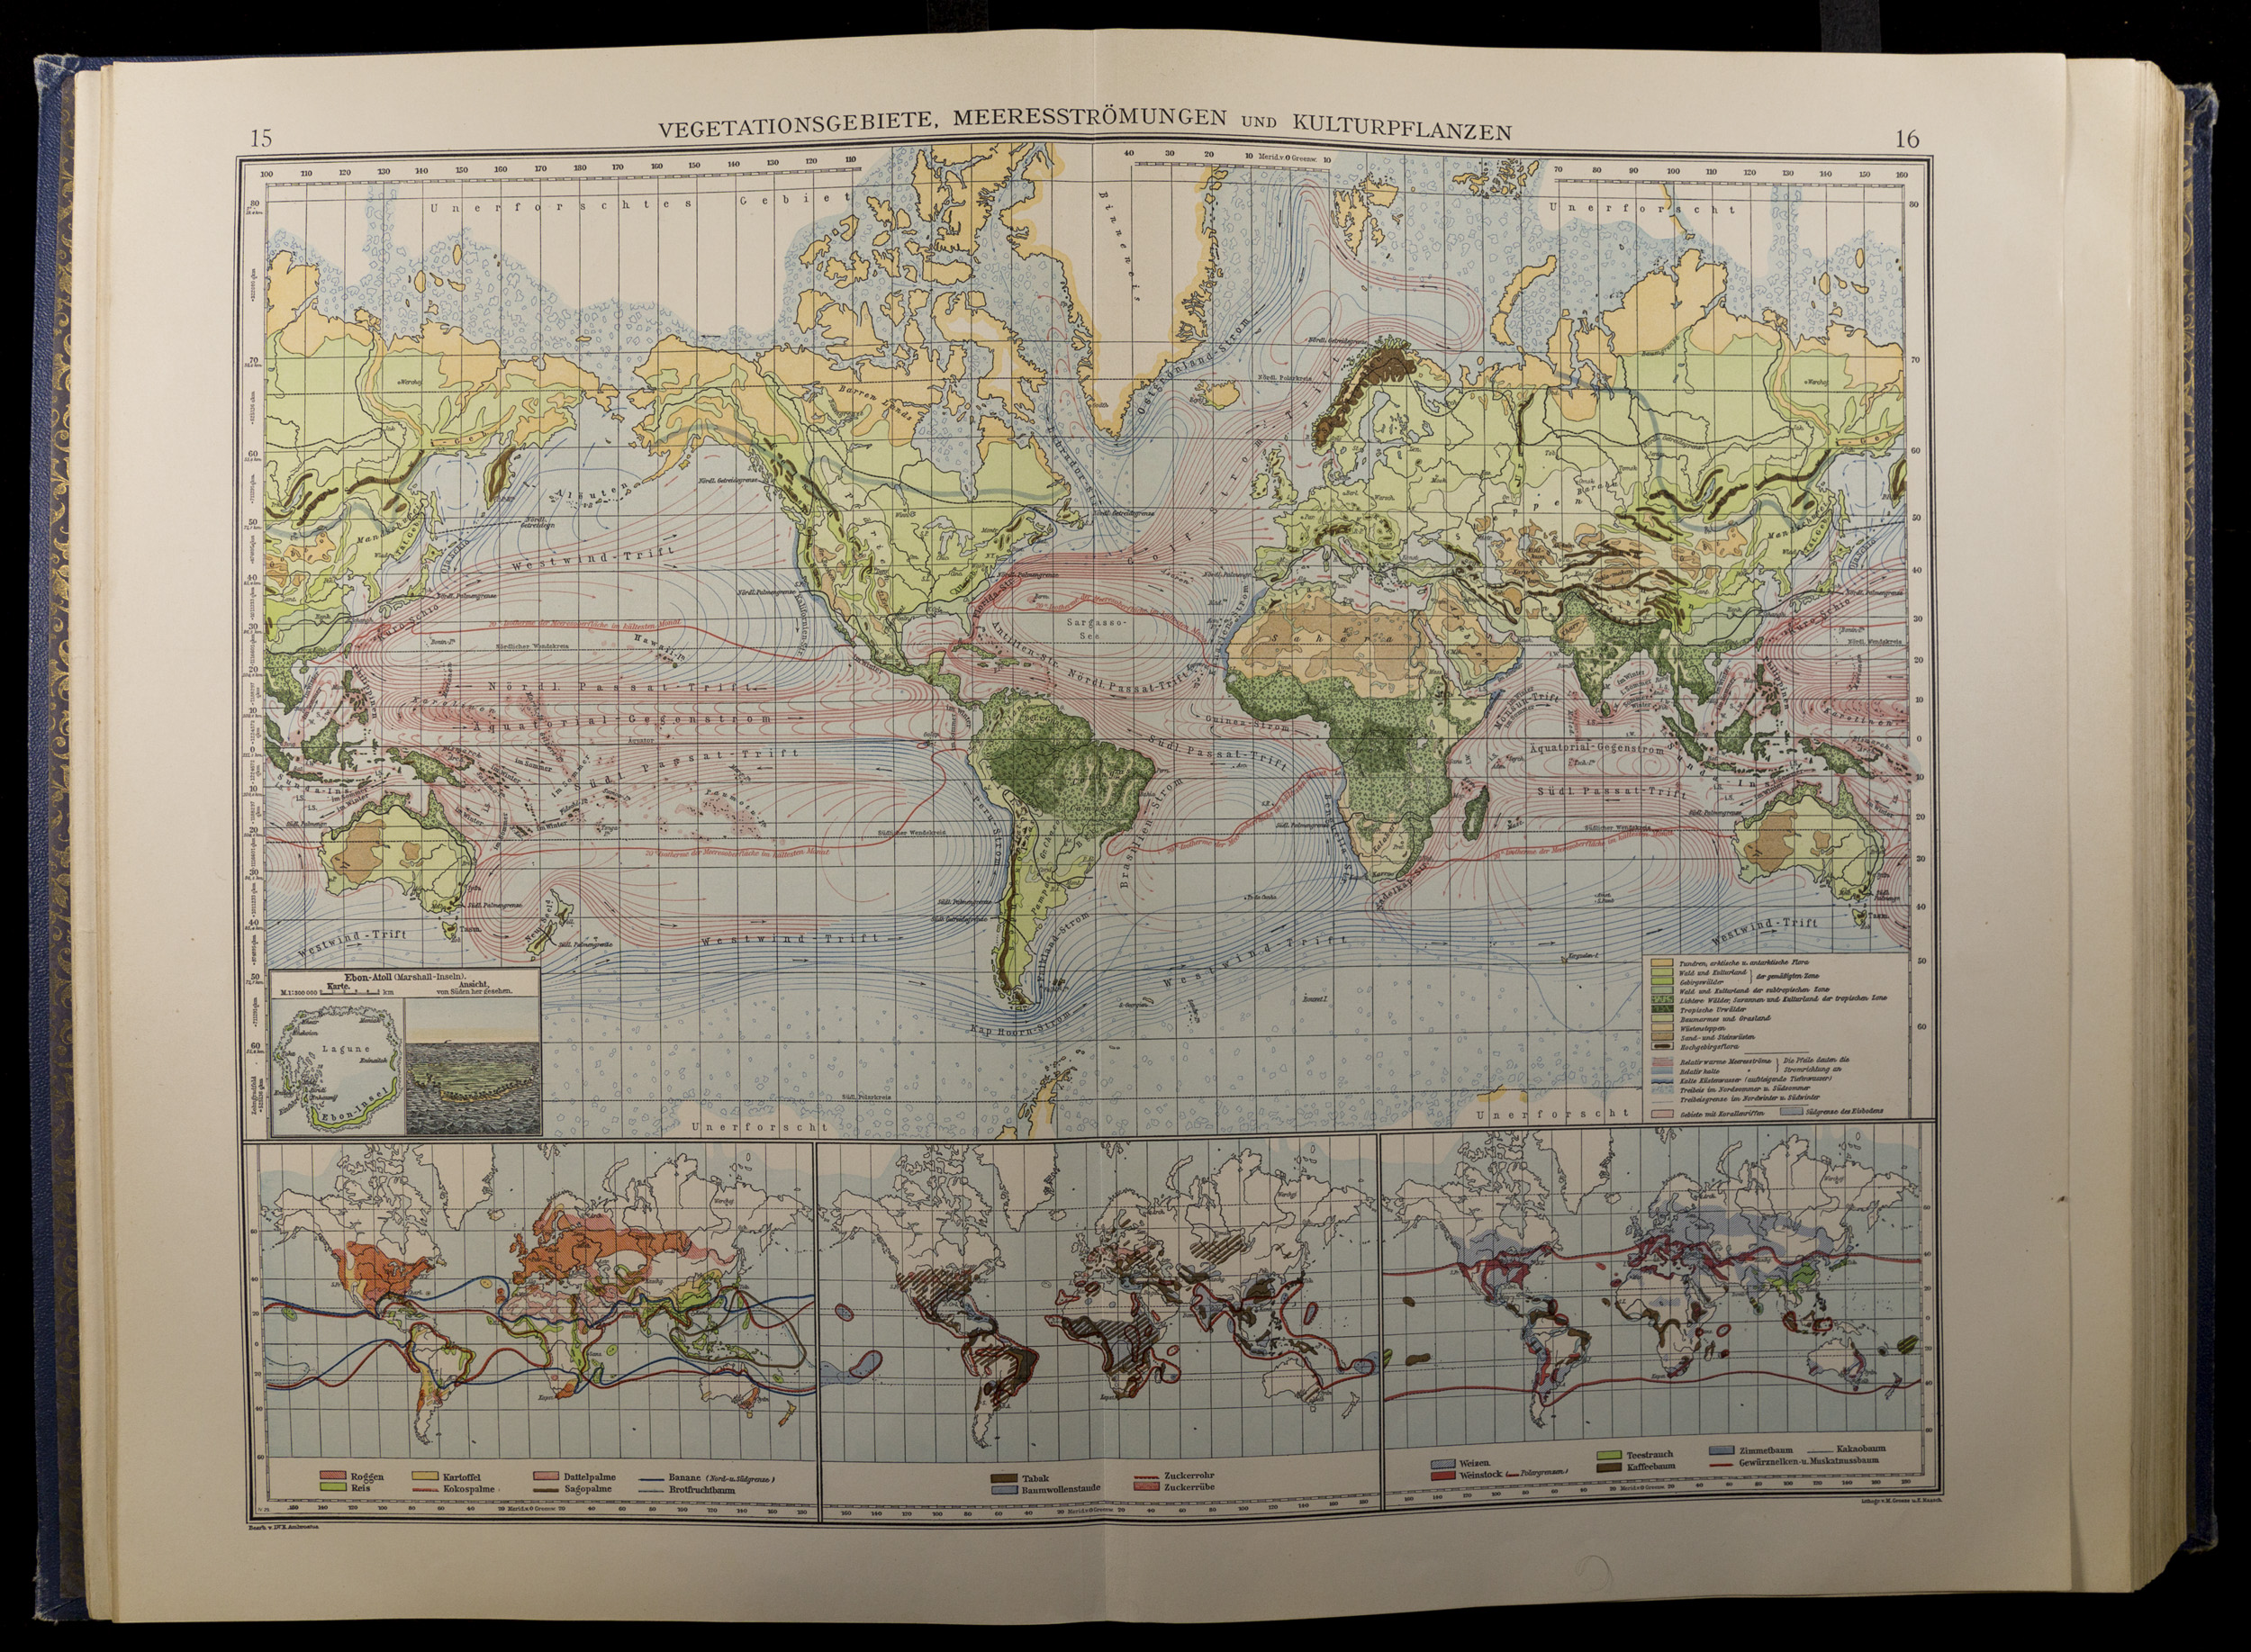
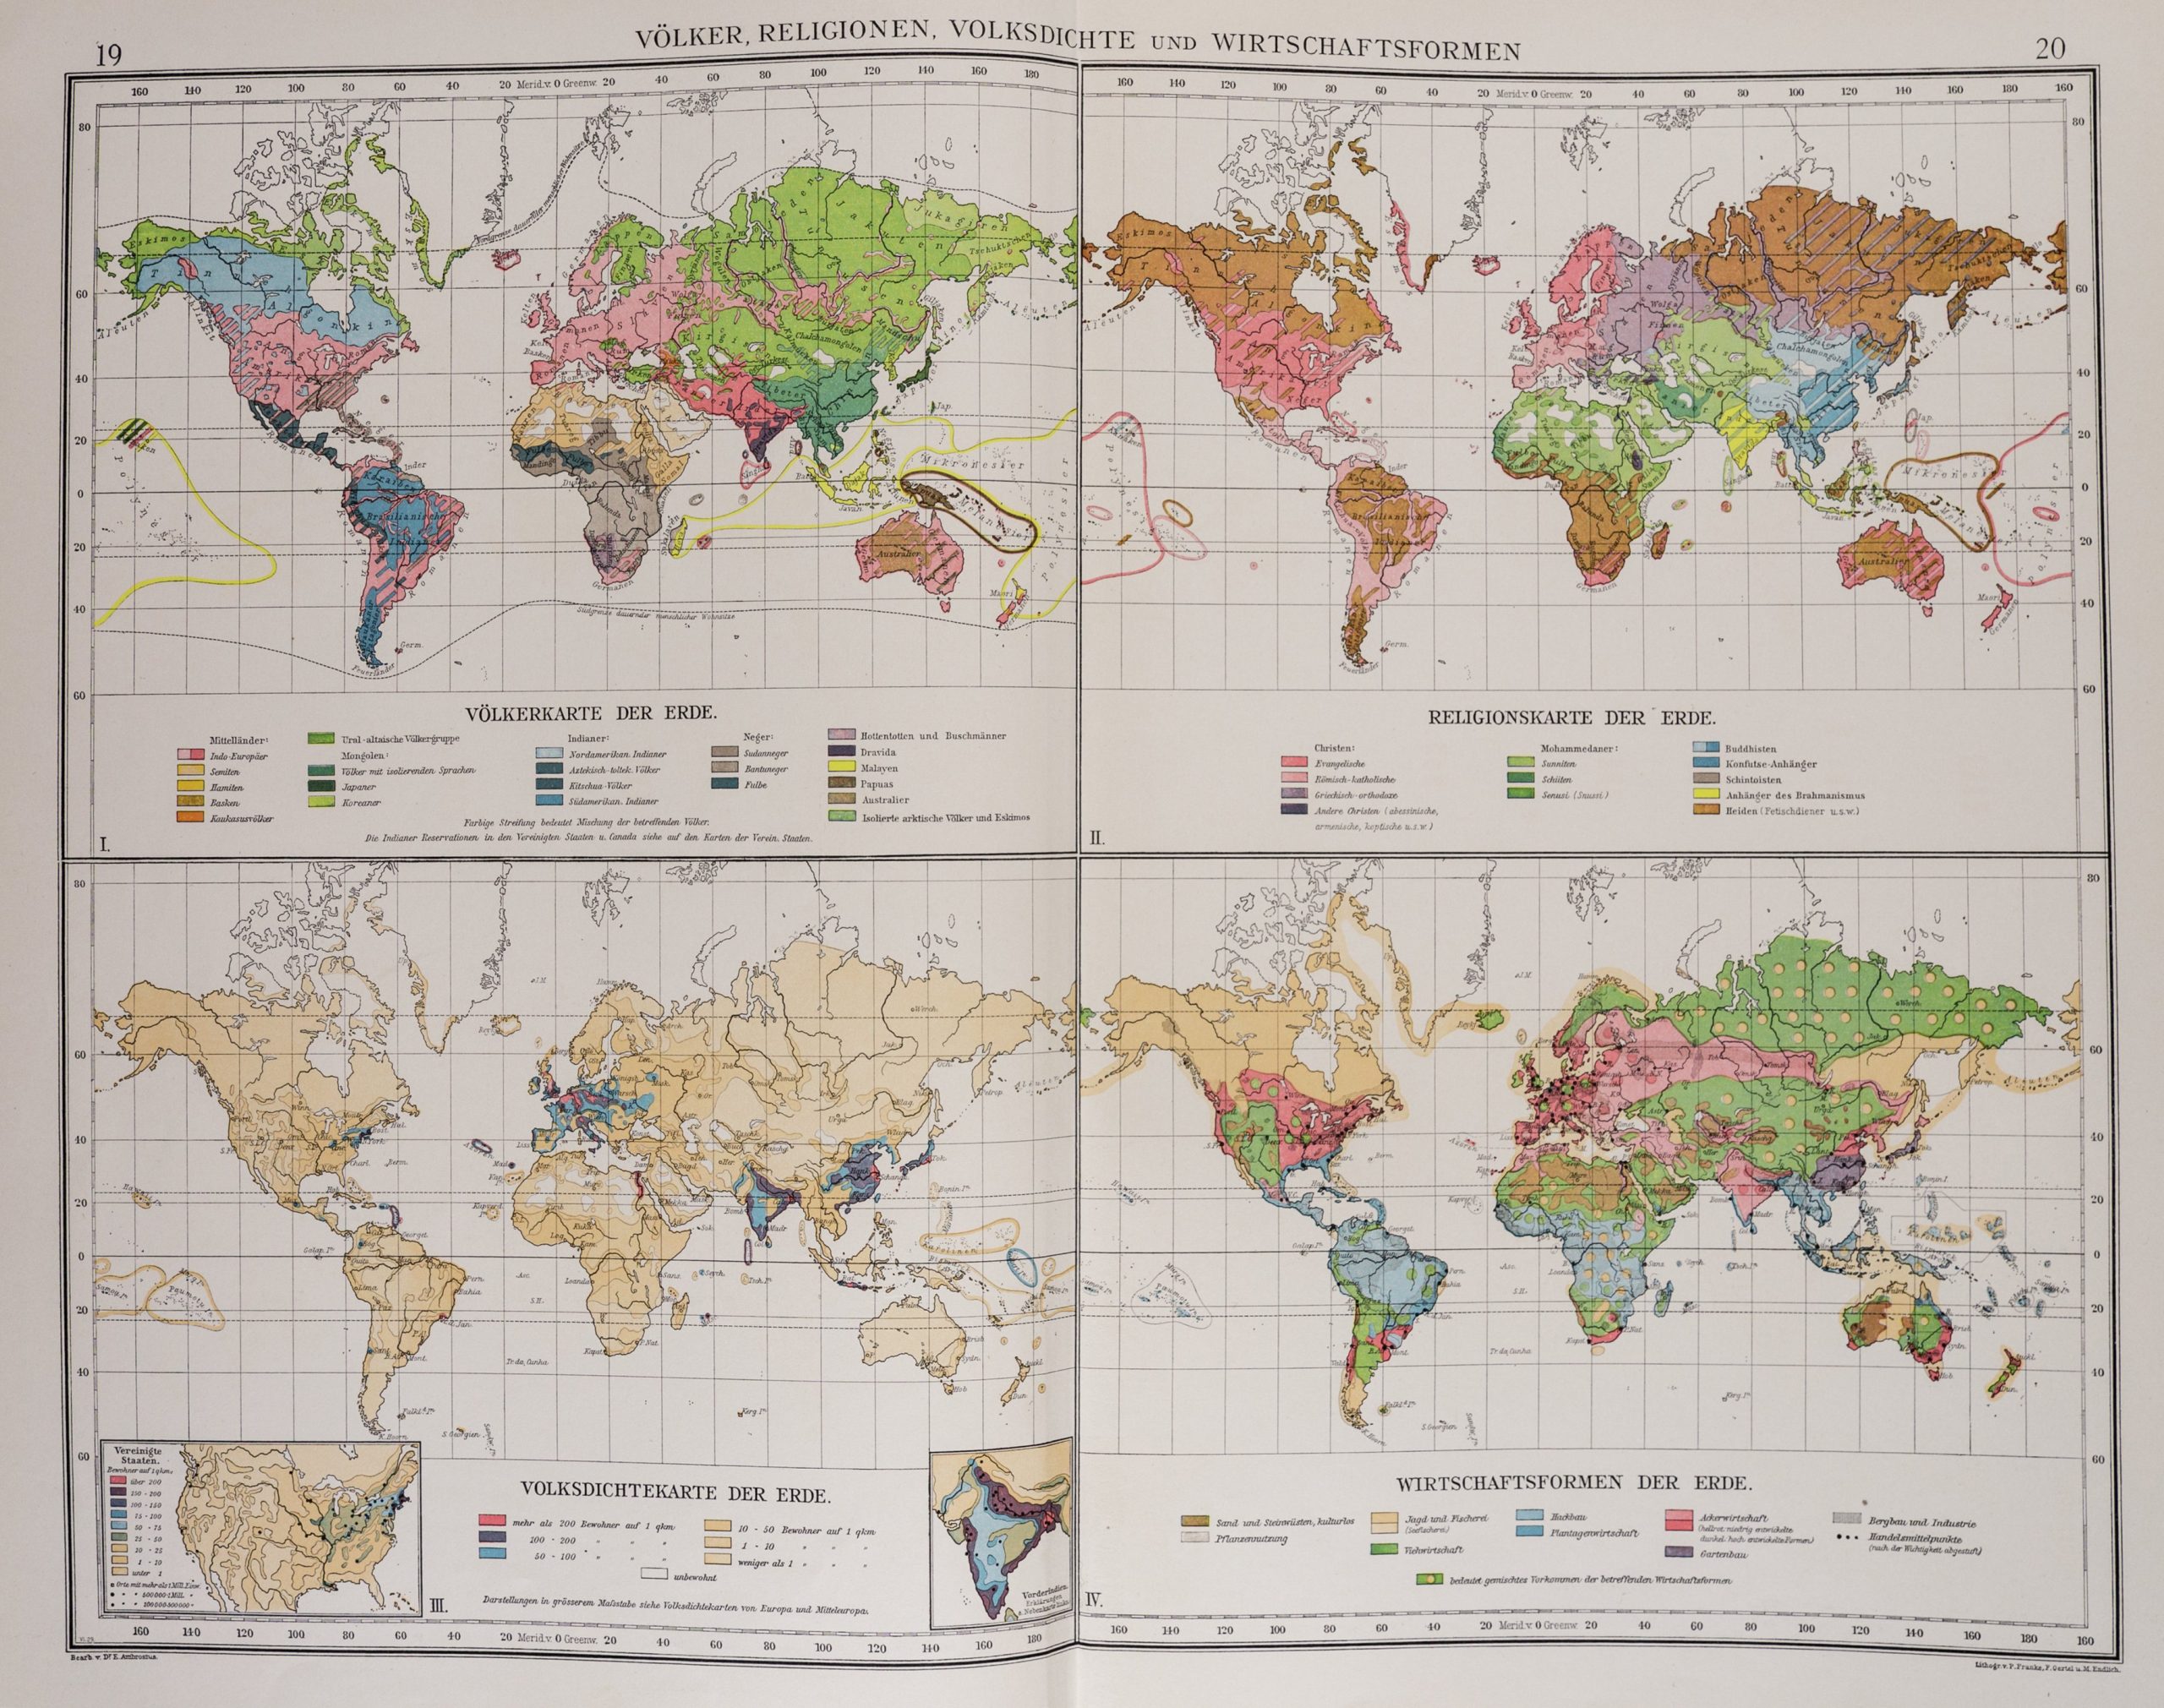
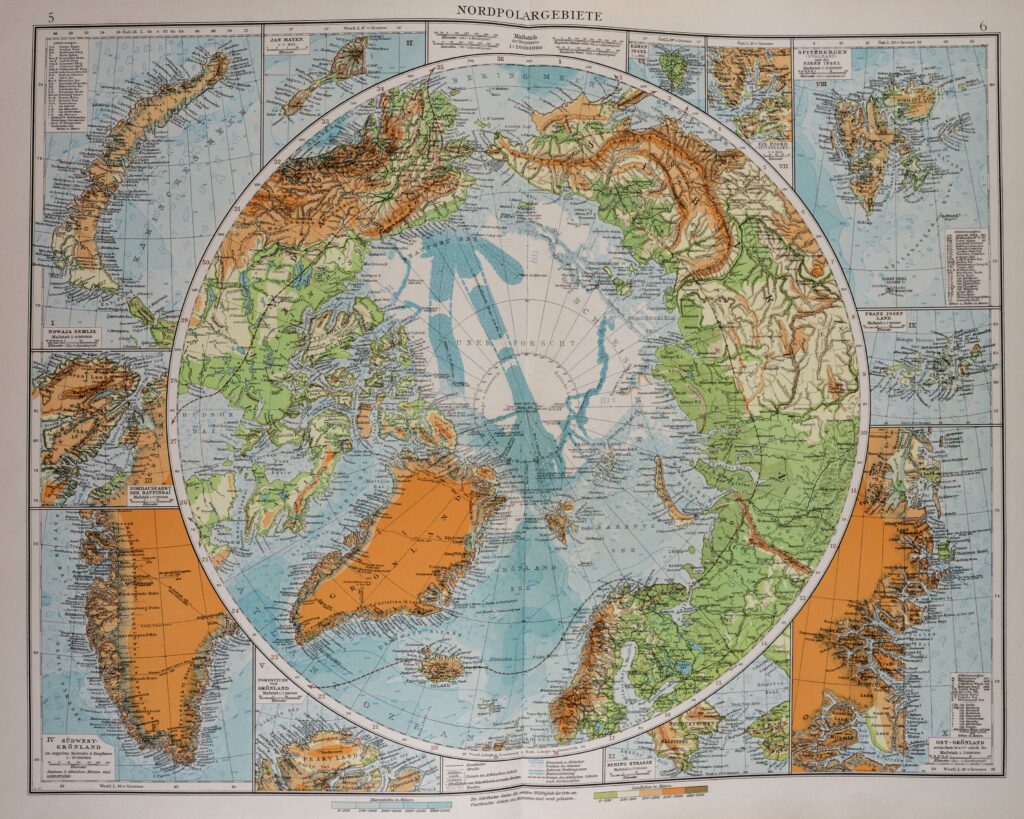
Andrees Allgemeiner Handatlas, published in Leipzig for many decades beginning in the late nineteenth century, was one of the world’s most popular atlases, and was translated into and printed in many languages under many different titles, including English, for a time in London as The Times Atlas. Each successive edition through 1930 contained more information on the earth’s surface than the previous had, as well as a progressively more extensive introduction for human methods for understanding that surface. The 1930 edition began by illustrating different ways of viewing the world and its surface conditions, from landforms and their structure to weather, climate, and vegetation, to characteristics of its human inhabitants, including population density and geographical distribution of occupations, religious faiths, and peoples.
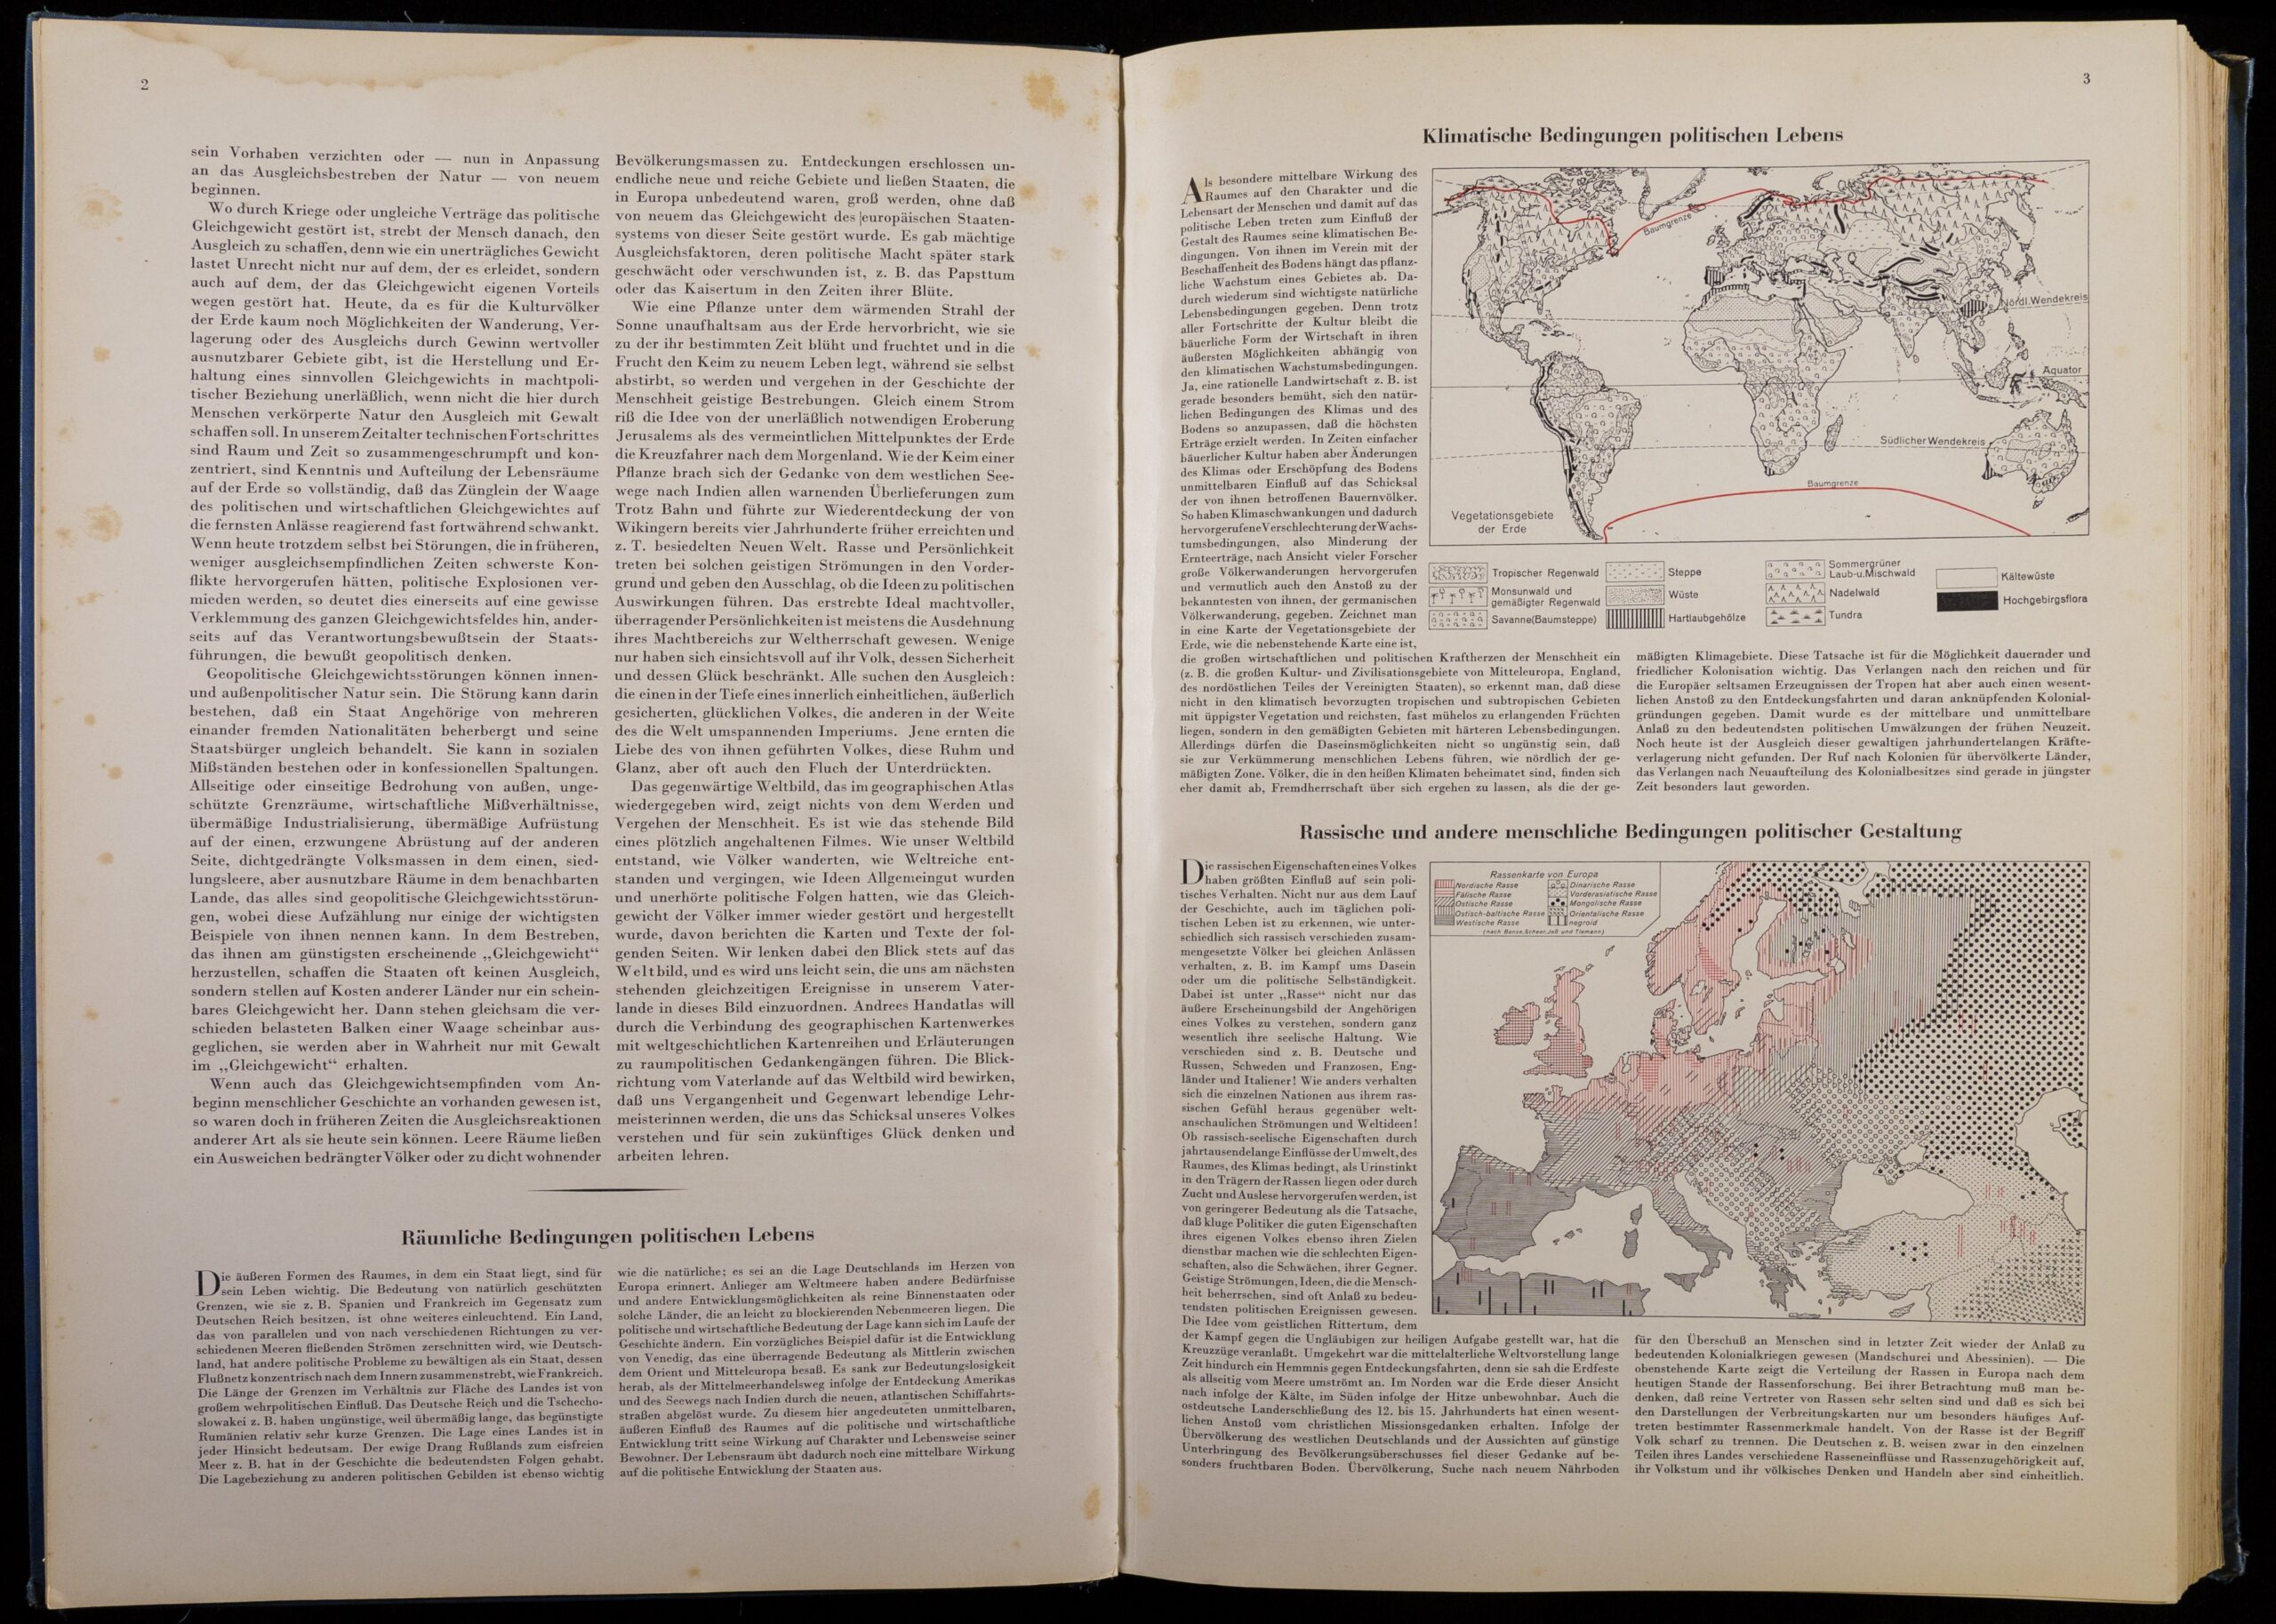
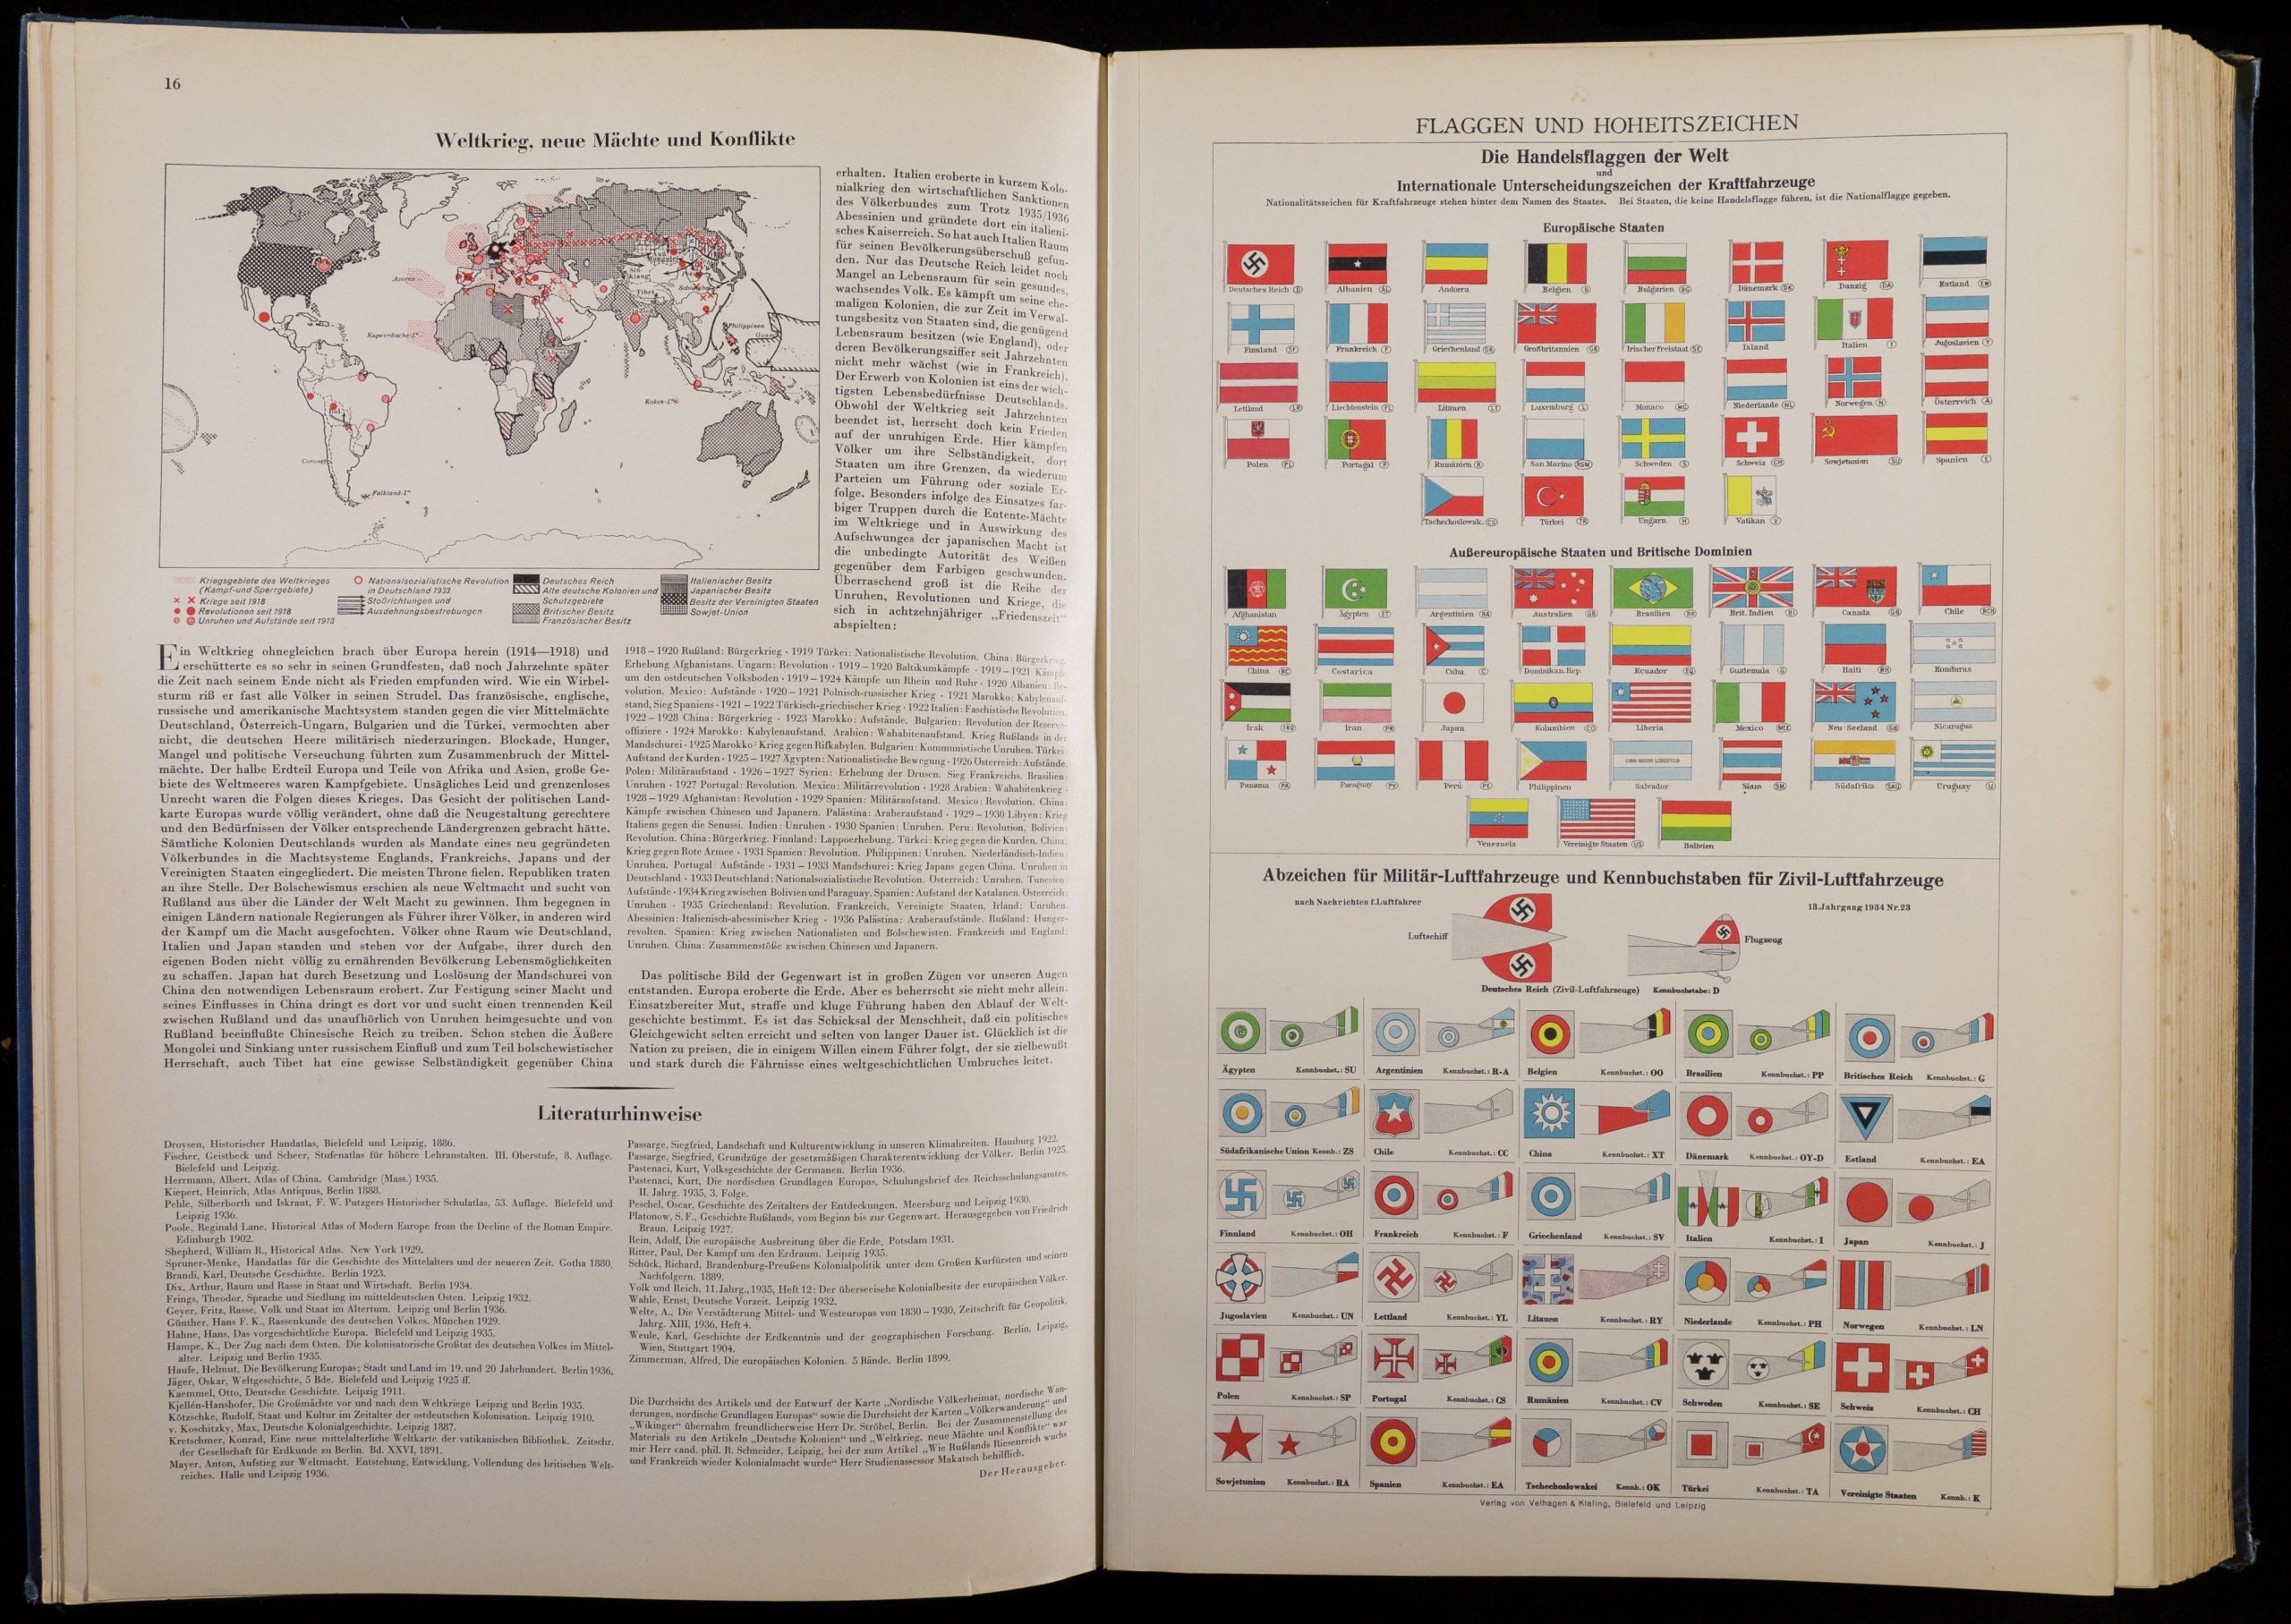
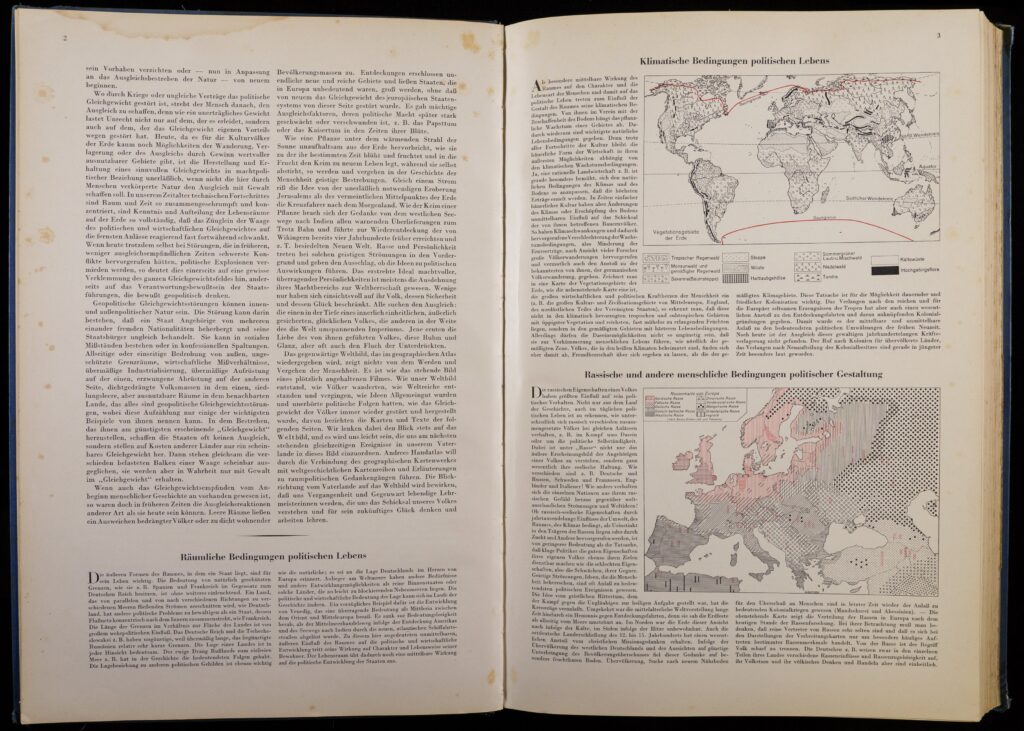
Andrees’ 1937 edition, published after Leipzig and its publishing industry had fallen under Nazi control, began with a very different story: An essay with maps and subheadings such as “Spatial Conditions of Political Life,” “Climatic Conditions of Political Life,” and “Racial and other Human Conditions of Political Organization.” This essay culminated in a section and map suggesting the inevitability of “World War,” followed by national flags and military insignia, as well as a world map illustrating nothing but territorial claims. The final edition of what had been a geographical atlas, from which one might draw historical lessons, became a distinctly historical atlas, but one overwhelmingly devoted to ideological propaganda.
Questions to Consider


Barbara Belyea, “Inland Journeys, Native Maps,” in G. Malcolm Lewis, ed., Cartographic Encounters: Perspectives on Native American Mapmaking and Map Use, Chicago: University of Chicago Press, 1998.
Jeremy Black, Maps and History: Constructing Images of the Past, New Haven: Yale University Press, 1997.
Anne Marie Claire Godlewska, “From Enlightenment Vision to Modern Science? Humboldt’s Visual Thinking,” in David Livingstone and Charles J. Withers, eds., Geography and Enlightenment, Chicago: University of Chicago Press, 1999.
Richard Pegg, “A Chinese Map of the World Dated 1858,” Mapline 125 (Autumn 2016).