


The contemporary North American landscape of cities, suburbs, and malls; highways, rails, and controlled rivers; fields, and fences; and factories, mines, and ports is the product of a long process of extraction, production, and exchange of natural resources: their transformation into commodities.

Commodities are traditionally defined as objects possessing economic value. The significance of commodities to human societies can be traced as far back as one can look. Many of the oldest known written human laws concern the fair and just exchange of commodities. During the industrial revolution, a variety of important commodities came to visibly define how and where humans worked. A map of an industrialized region, for instance, might trace the life of a commodity such as a machine from its extraction in an iron mining community to its production and fabrication in a steel town, and distribution and exchange through various commercial centers, often ports. Making sense of commodity-dominated modern lives and managing the distribution of commodities became the primary issues around which some of the most influential ideologies of the last century—capitalism and communism—were theorized. Together, these facts underscore the significance of commodities and how we understand them in our lives.
The contemporary North American landscape is the product of a long process of extraction, production, and exchange of natural resources: their transformation into commodities.
Economic historians are trained to think of human history in terms of the economic value that is extracted from the earth or from human labor, and from which further value is produced and exchanged over time. In the same vein, anthropologists have categorized early human societies in terms of extraction, production, and exchange. This categorization identifies a broad sweep of a human history understood in terms of transitions from hunting and gathering societies to agricultural, commercial, and industrial societies. How we extract, produce, and exchange economic value, these scholars reveal, helps to explain where we are in history, where we are on the surface of the earth, and perhaps even who we are.

Convinced that studying the landscape offers a unique perspective on human history, especially at the local and regional level, a number of geographers and historians have recently sought to visually interpret the landscape as a source of historical evidence. Historians such as William Hoskins and Marc Bloch and, more recently, geographers such as Pierce Lewis and Donald Meinig have suggested studying human life by exploring the landscape on foot. Yet we might also consider studying human life through visual representations of landscape, such as maps. Maps, like commodities, are as old as history itself. They have been used for land and sea navigation; claiming territories and boundaries; studying landforms, seas, and weather patterns; locating, managing, and conserving natural resources, as well as extracting those resources and producing and exchanging them as commodities. The form, scale, and content of many maps can often be interpreted in terms of these uses, giving a sense of economic regions, where human life and work has become arranged along sites of extraction, production, and exchange.
The following collection of documents brings together maps, illustrations, and other materials from a range of periods and places in order to explore how natural resources become commodities and how the extraction, production, and exchange of those commodities has shaped the American landscape and its history.
Essential Questions
In 1909 the U.S. Department of Commerce released an extensive report on the current state of domestic waterborne transportation. The report revealed a decline in traffic on rivers and canals, but a significant increase in the amount of freight being transported via “deep waters,” like the Great Lakes. Most of that freight was bulk freight: raw materials and low-grade products that were easy to ship over water in large, heavy loads. The Great Lakes offered an efficient link between sites of extraction, such as iron ore deposits around Lake Superior, and industrial and commercial centers in port cities like Chicago. By connecting the locations and processes of extraction, production, and exchange, the Great Lakes waterways fostered a distinct economic region. Indeed, by the time the Department of Commerce released its report, the Great Lakes of North America had emerged as the continent’s primary manufacturing region.
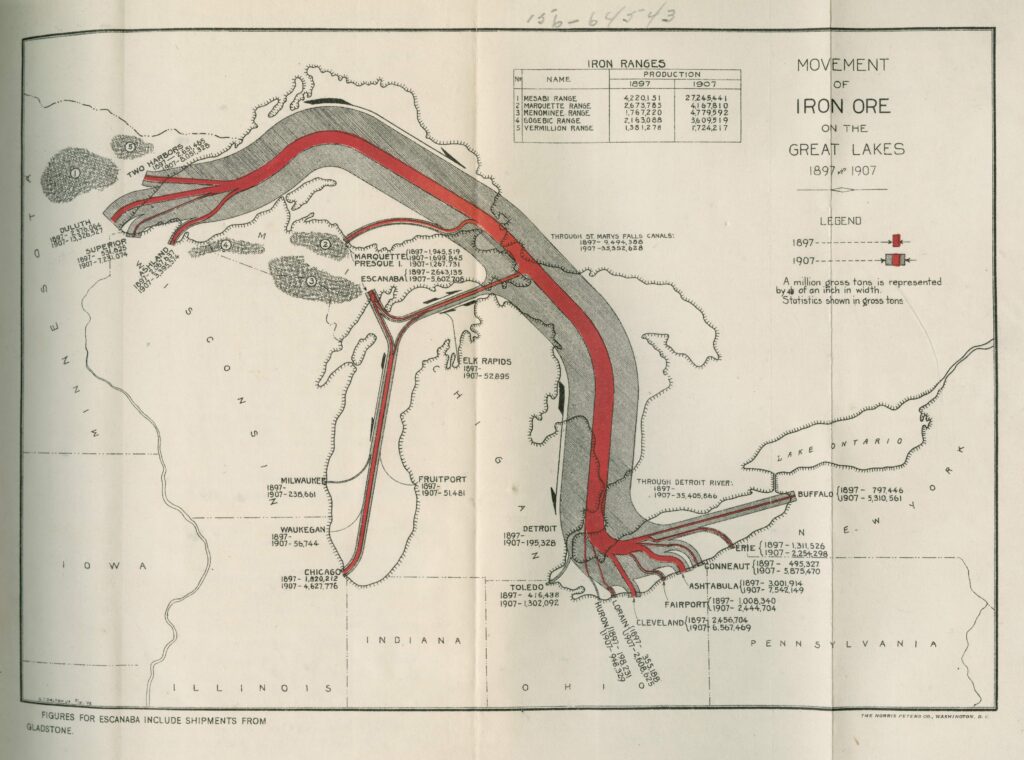
Rich iron ore deposits in Michigan, Wisconsin, and Minnesota supplied much of the raw material sustaining the Great Lakes manufacturing region, and helped make the United States the world’s leading producer of iron ore. In the late nineteenth century, more than 80 percent of the iron ore extracted in the country traveled across the Great Lakes on its way to ironworks in industrial centers like Pittsburgh, Pennsylvania. The Department of Commerce captured the iron industry’s growth in the first map below, which accompanied its report of waterborne transportation. Arrows show the direction of movement as well as the relative difference in the amount of iron shipped in 1897 and 1907.
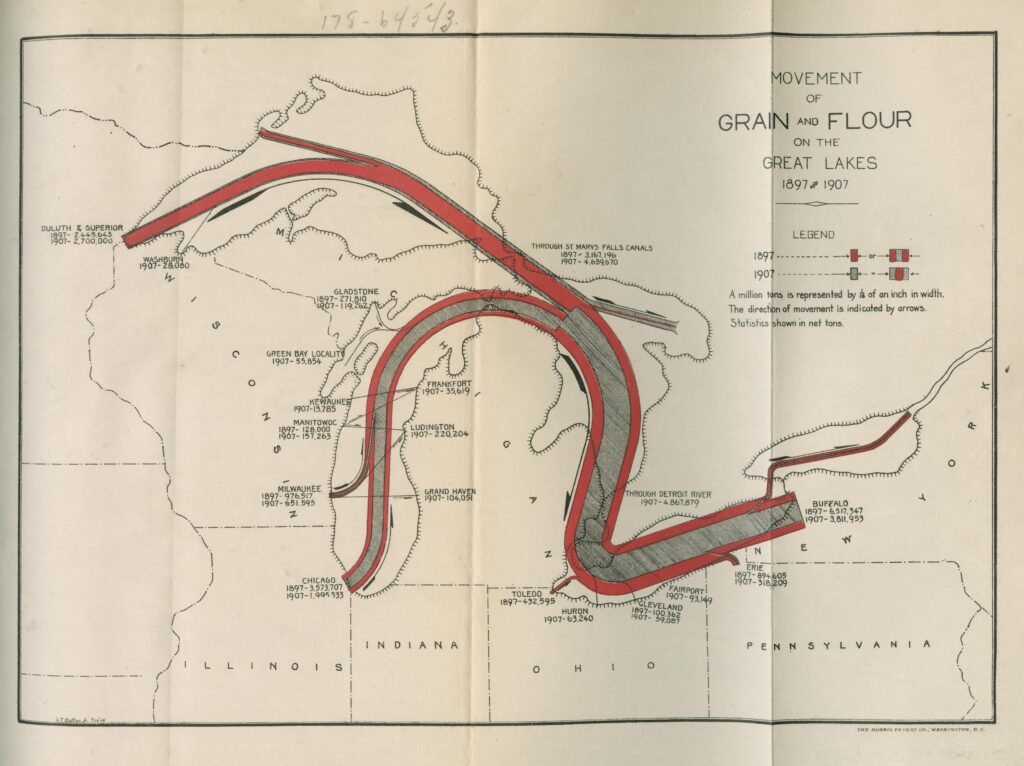
Just as the proximity of iron ore deposits to the Great Lakes made waterborne transportation the easiest and most economical means of getting the ore to ironworks, the movement of grain production and markets away from the Lakes in the same period contributed to a decline in the amount of flour moving over the Lakes. Instead of waterborne transportation, a growing number of producers began shipping grain and flour by rail, a shift reflected in the second map.
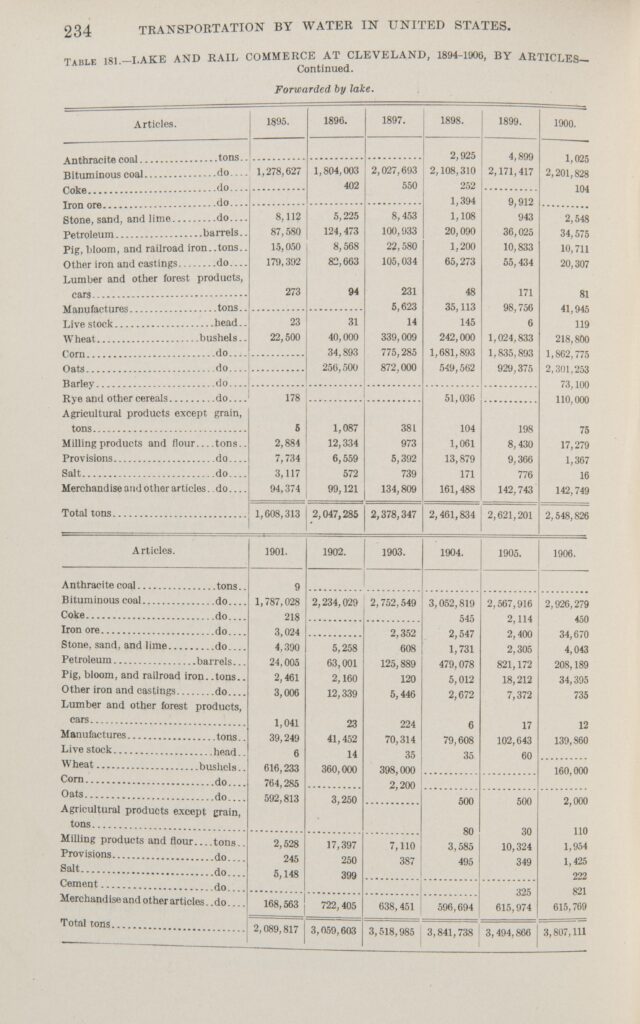
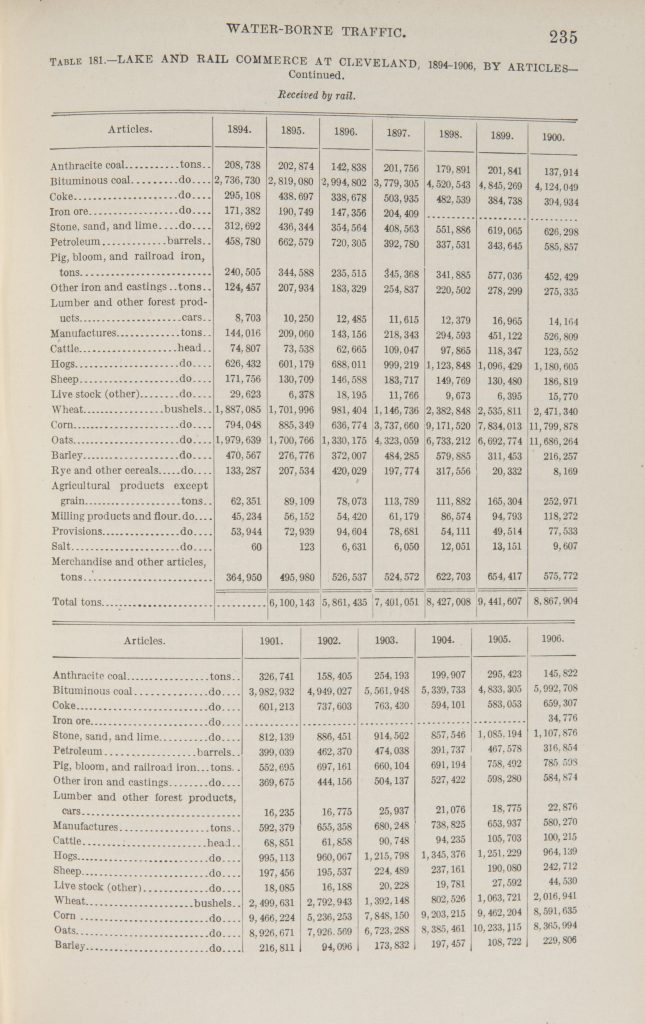
Railroads siphoned some waterborne traffic, but also helped to knit the Great Lakes economic region together. Port cities like Cleveland, Ohio facilitated the movement of commodities by linking waterborne transportation on the Lakes to the nation’s expanding railway system. Cleveland, situated along the shores of Lake Erie, thus became one of the leading lake ports in the late nineteenth century. The final source below, a table from the Department of Commerce report, reveals the variety and abundance of commodities that passed through the city between 1894 and 1906, traffic expedited by modern dockside machinery that helped workers quickly load and unload vessels moored at the port.
Questions to Consider
The process of extracting commodities from the land often occurred in waves; when one commodity became depleted, focus shifted to another. As the documents in this section suggest, these waves of extraction were often linked—layered on top of what came before. Clearing an area of timber, for instance, could facilitate later extraction of mineral resources.
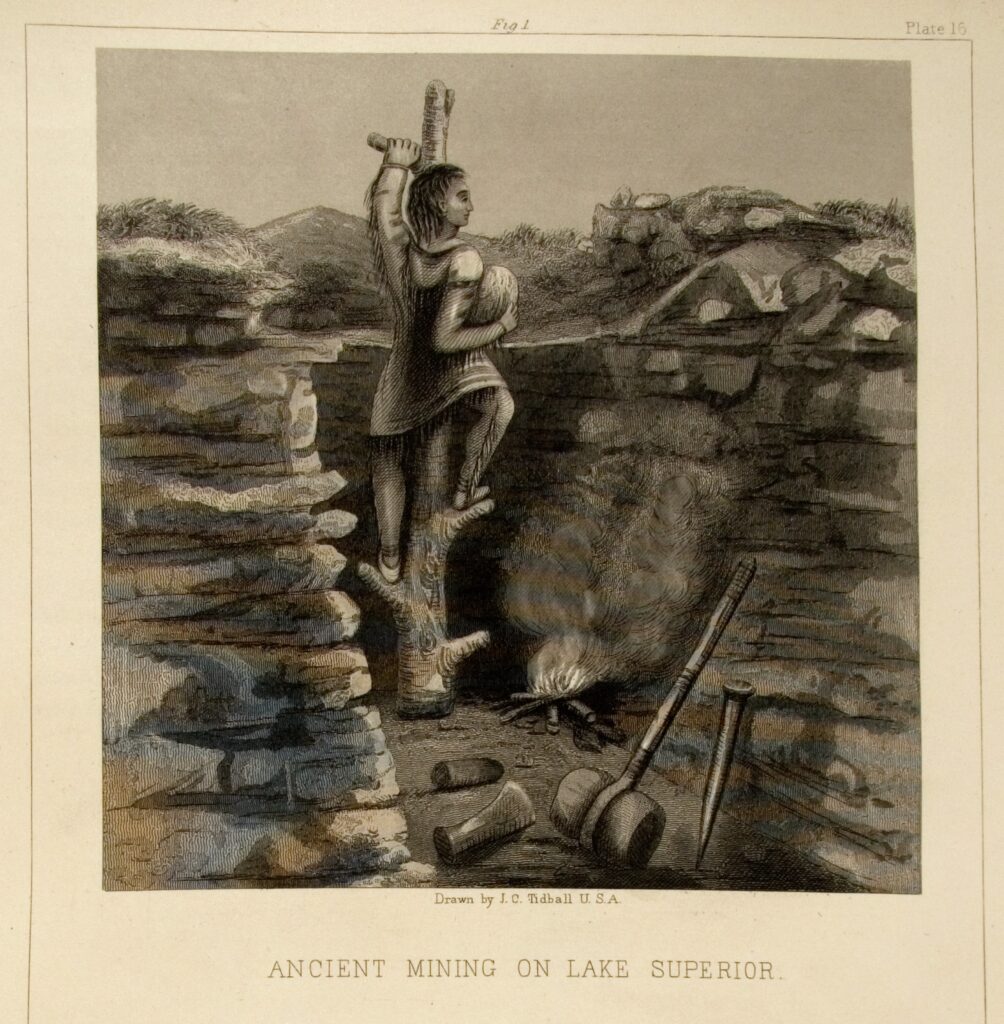
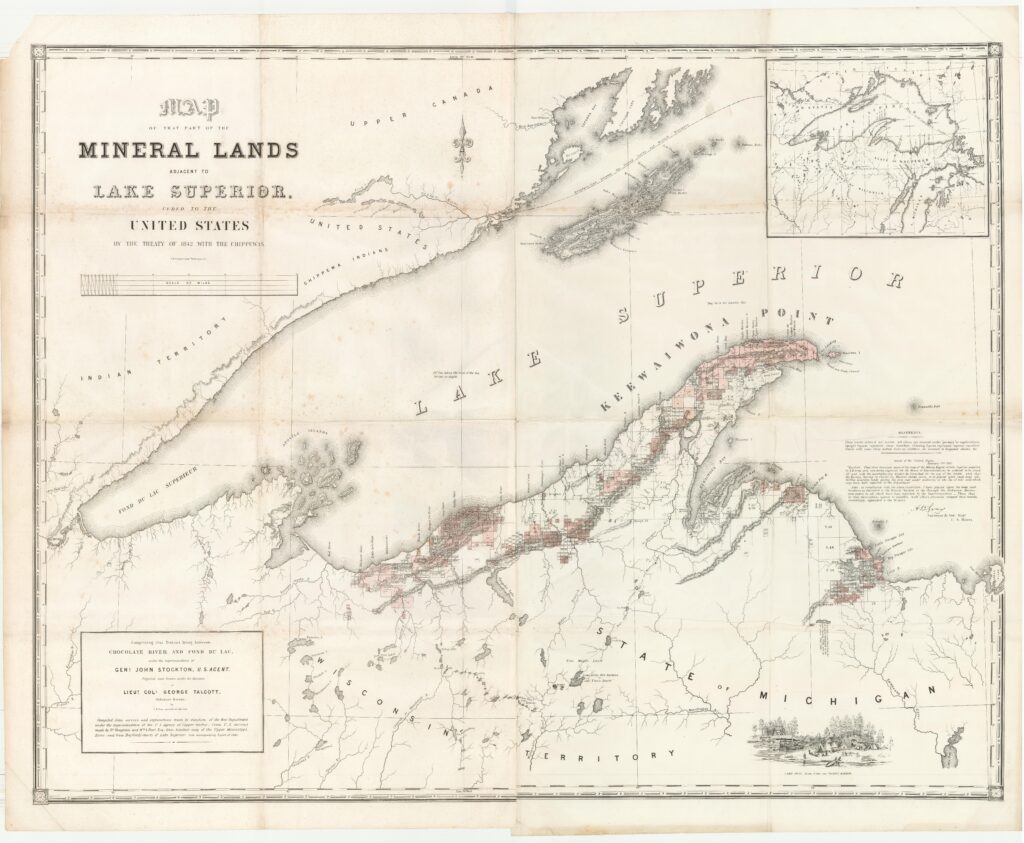
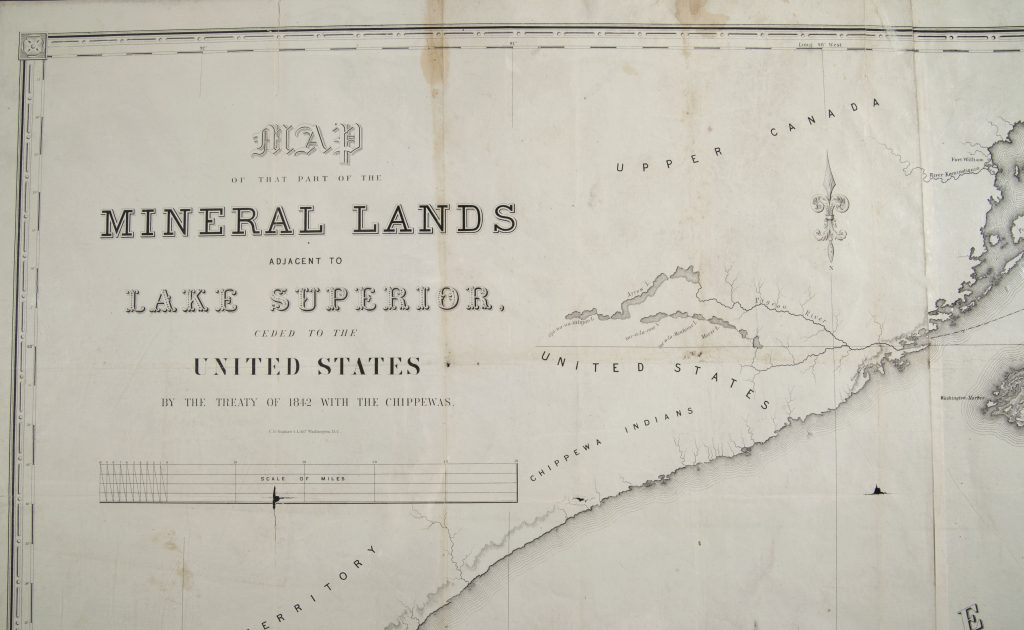
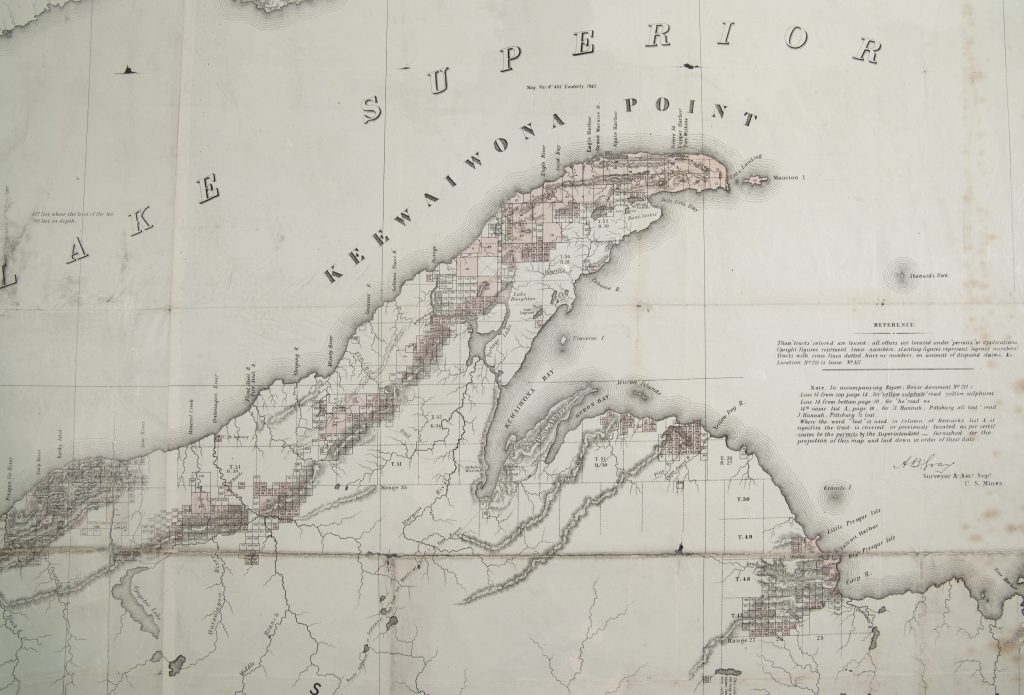
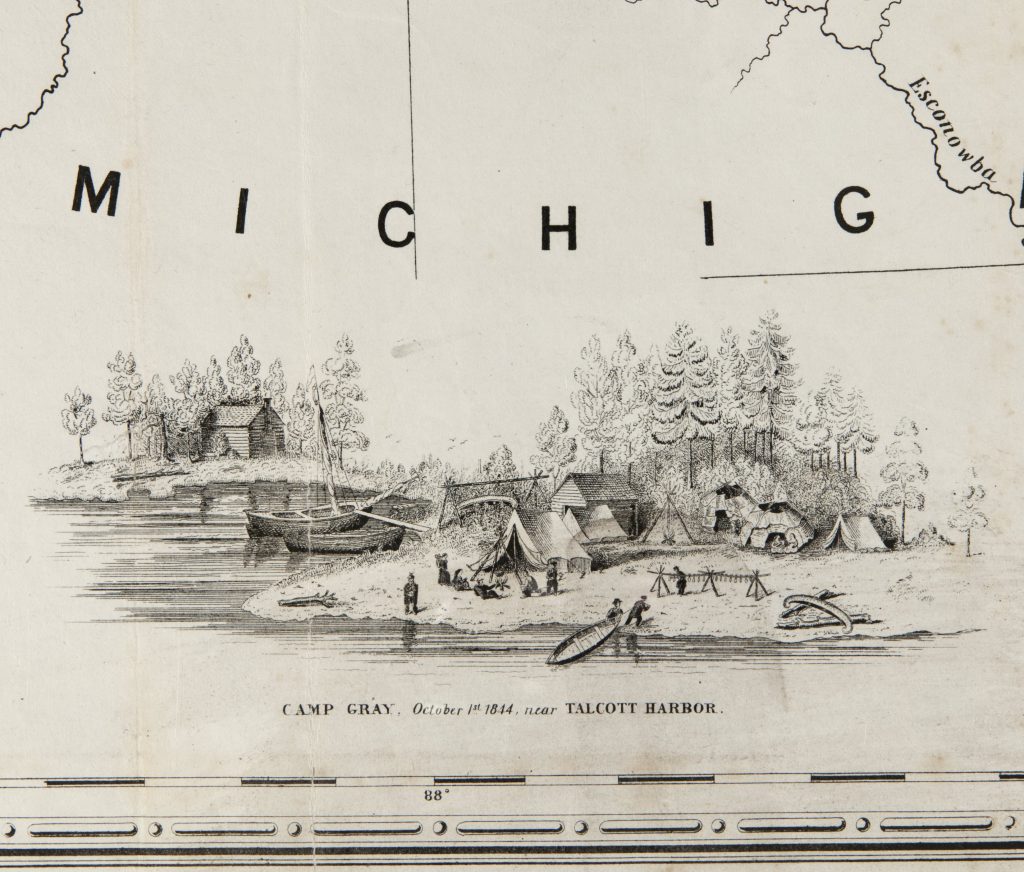
The items below, details of a larger map of the Mineral Lands around Lake Superior, place the pursuit of commodities into its territorial context. These Mineral Lands contained rich deposits of metal ores, essential elements in the processes of industrialization and urbanization. When manufactured into iron and steel, these metal ores also made it possible to construct the railroads involved in mass settlement of the continent. Mineral Lands had to be formally ceded to the United States by treaty with the indigenous nations already there in order for their potential wealth as commodities to be developed on a mass scale by U.S. interests. J. C. Tidball’s illustration of indigenous mining around Lake Superior, prepared for an 1855 Bureau of Indian Affairs report on American Indians, underscores how late nineteenth-century mining around Lake Superior constituted only the most recent layer of extraction.
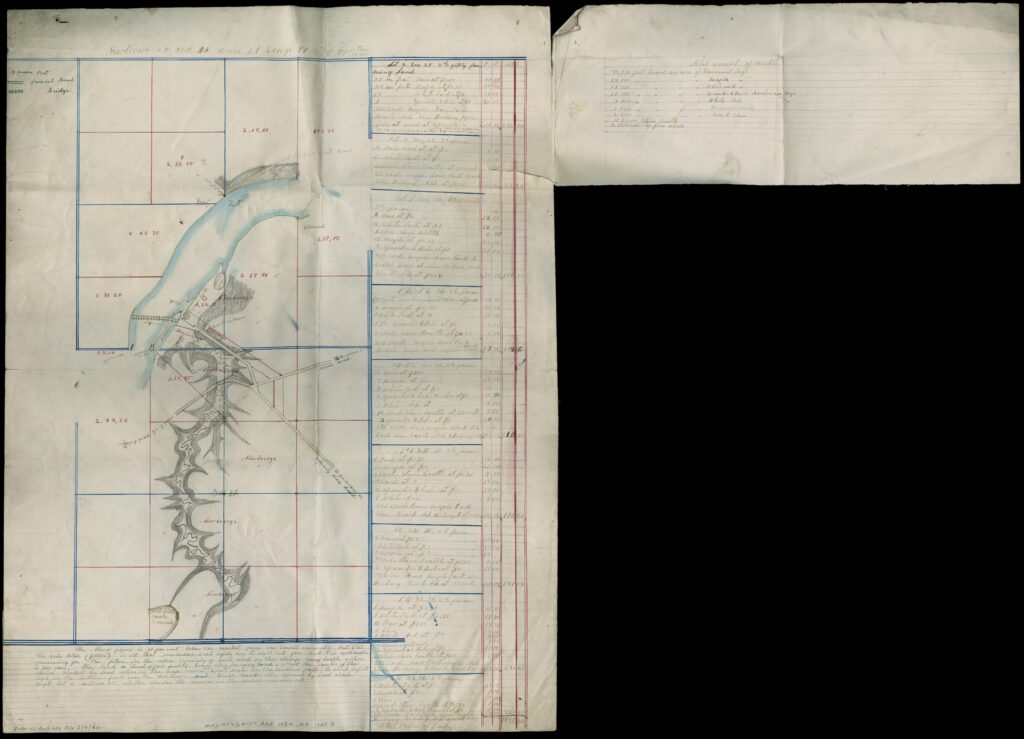
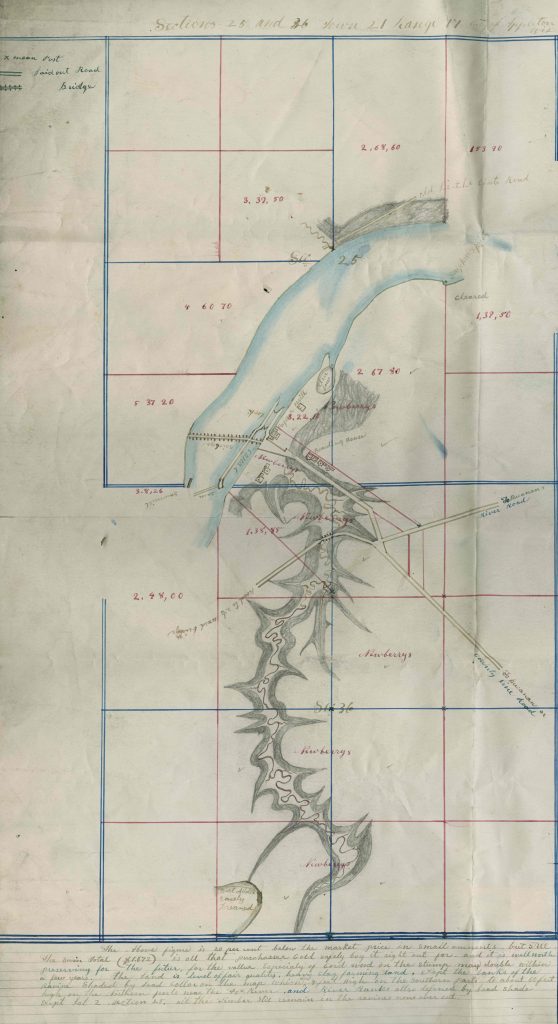
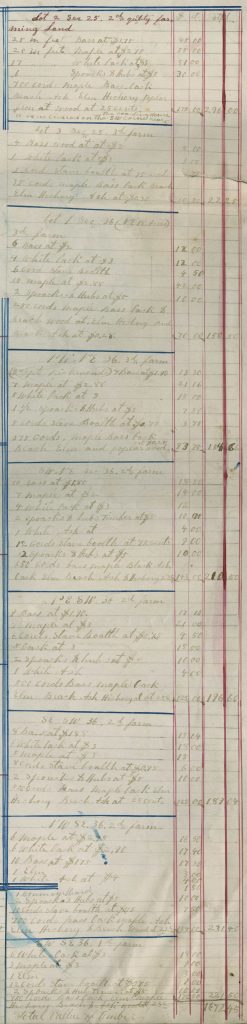
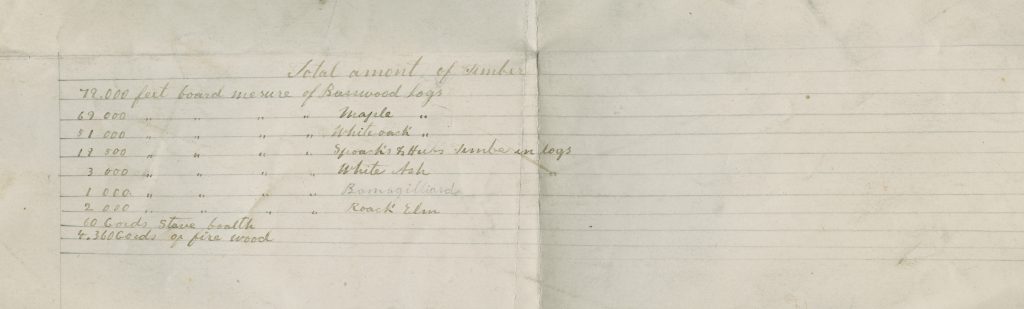
Walter Loomis Newberry’s map of his land holdings in the Fox River Valley of Wisconsin highlights a local chapter of the harvesting of lumber across the continent. Drawn around 1860, at the dawn of the Great Lakes logging boom of the late nineteenth century, the map ties that commodity to a specific physical environment. Streams abutting Newberry’s land, for instance, would serve a crucial function in transporting the timber harvested there to mills for processing into lumber as well as markets for consumption. Annotations in the margins list “Total Vallue [sic] of Timber,” arranged by subsections, tree species, and projected cordage and market prices. In this map, land itself becomes a commodity, as its real estate value at this time becomes based in the value of timber it contains.
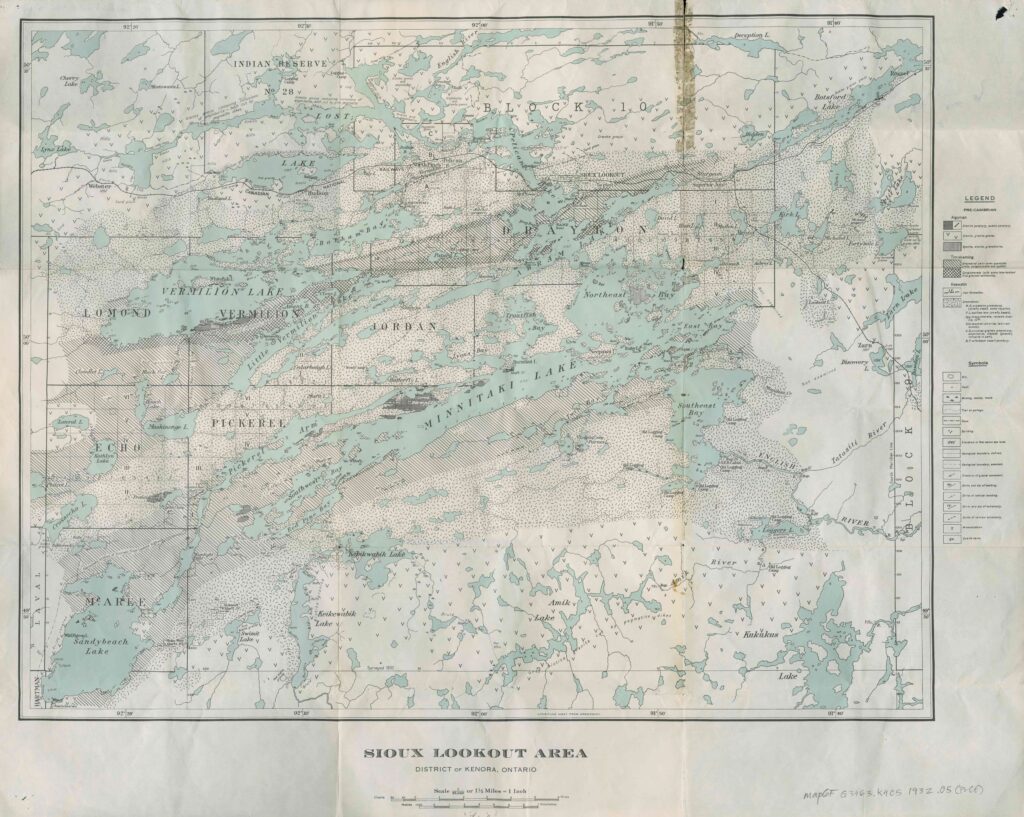
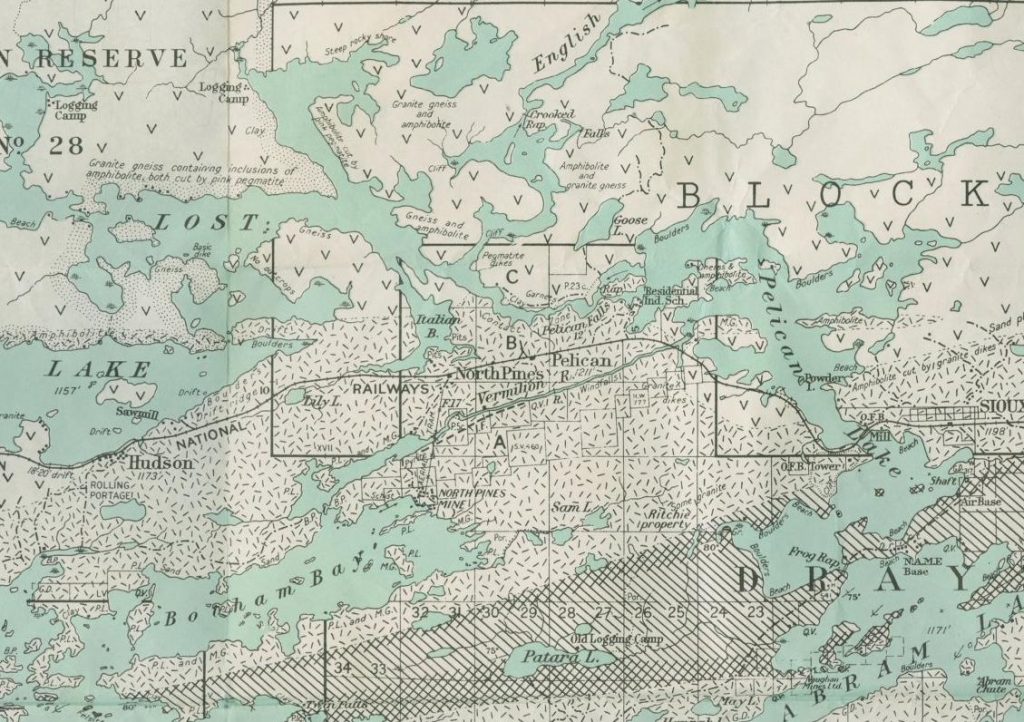
Surveyors for the Ontario Department of Mines prepared the map below in the early twentieth century, between distinct waves of extraction in Northwestern Ontario, Canada. The area depicted has been logged, and shows the vestiges of logging infrastructure. Yet the scale and shape of the map have been drawn to illustrate the results of a geological survey of the area in pursuit of mineral wealth. The clear-cut landscape presumably made the act of surveying the land easier; future mining in the area would thus build on the previous layer of extraction.
Questions to Consider
The exchange of commodities played a crucial role in larger processes of urbanization, particularly in places like Chicago. Commodities like iron, timber, and coal provided the raw materials used to construct cities, while their exchange shaped how individuals, companies, and municipalities organized their communities.
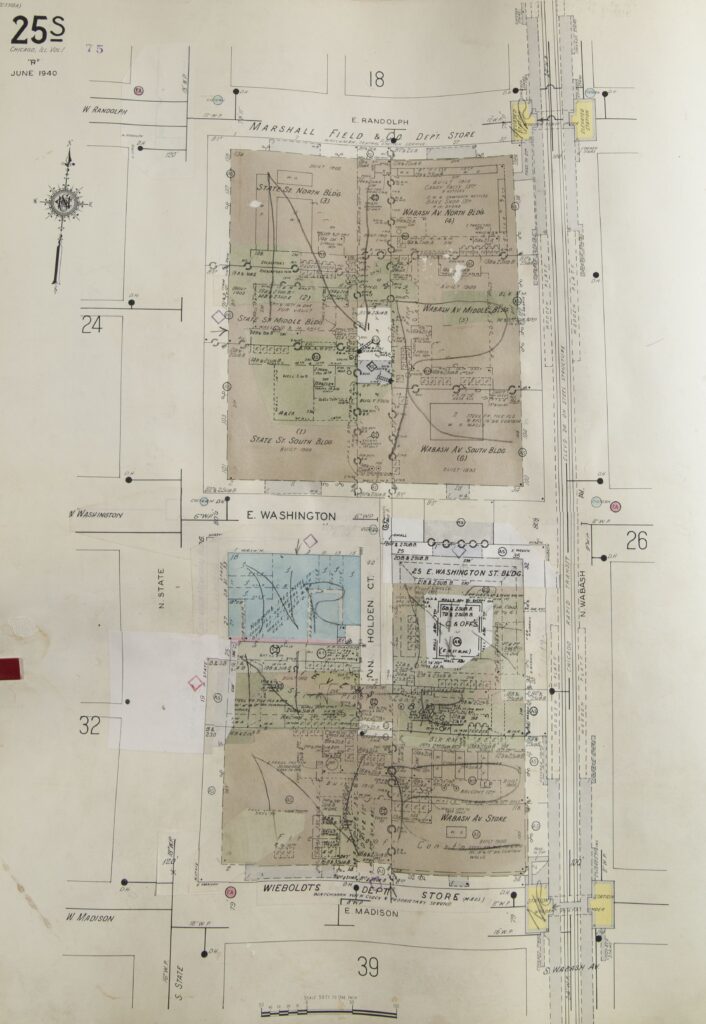
Sanborn Insurance maps presented the city block by block, with the goal of taking stock of the value of all real estate in the city. Peoples Gas, Light, and Coke Company, now known as Peoples’ Gas, updated the map below in pieces, by simply pasting over old information. Keeping the map current allowed the company to maintain distribution of and infrastructure for commercial, industrial, and residential gas consumption. Details on the map give clues as to how the centers of cities developed into commercial districts structured to facilitate centralized and efficient exchange of commodities. In the map here, Marshall Field and Company and Wieboldts, two of Chicago’s leading department store chains for much of the twentieth century, compete for dominance on some of the most desirable real estate in the city. Tellingly, these commercial blocks were just a short distance away from commodities and stock exchanges taking place at such institutions as the Chicago Board of Trade and the Chicago Mercantile Exchange.
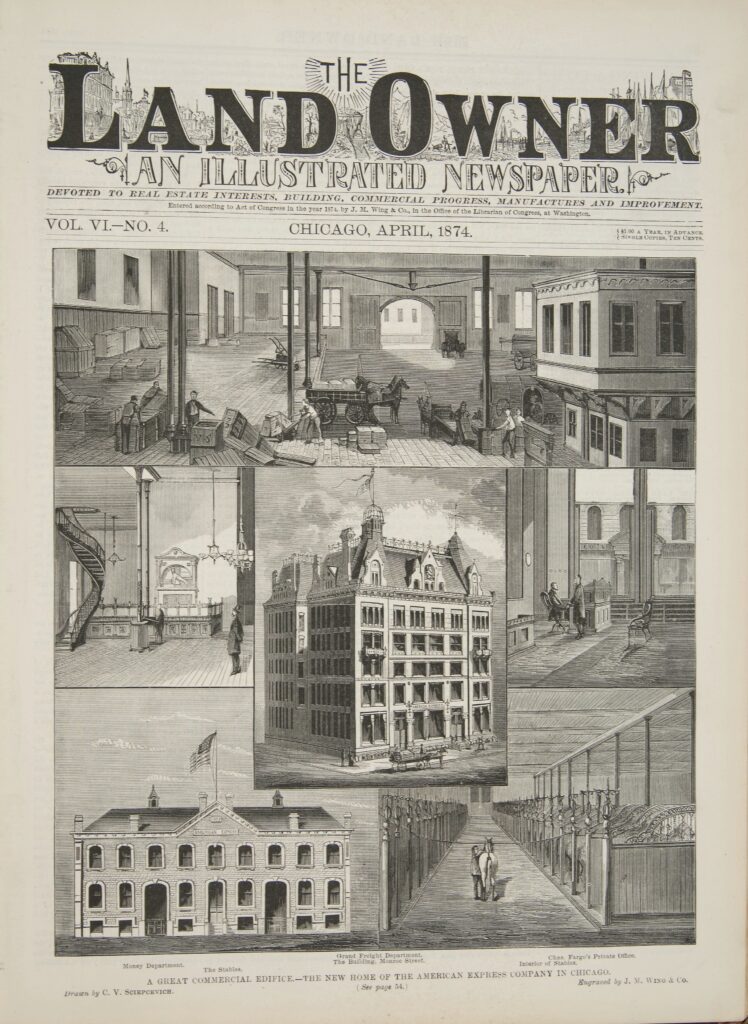
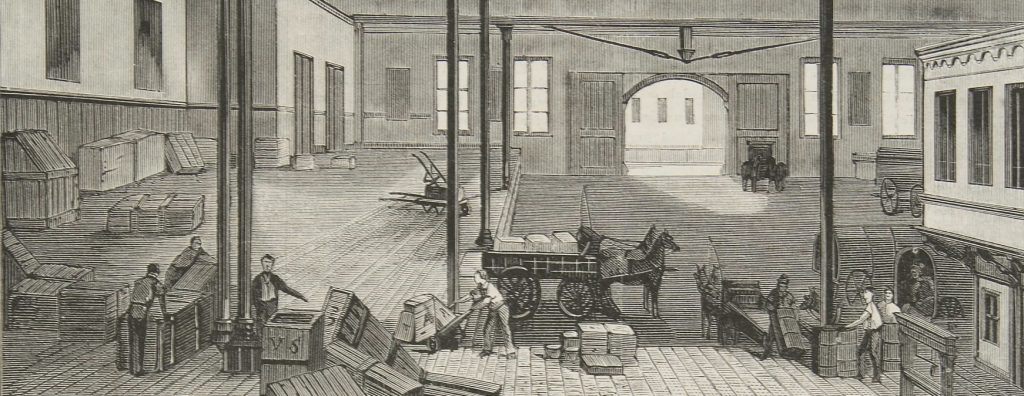
One block south of Wieboldts stood another “Great Commercial Edifice,” the Chicago headquarters of the American Express Company. Founded in 1850, the American Express Company specialized in the transport of parcels, money, and other valuable commodities via express trains and coaches. The company’s new building was designed in 1872 by the famed architect H. H. Richardson. Special features, such as large ground-floor windows and a light court that divided the structure’s upper half, allowed sunlight into the interior packing rooms and offices, while a nearby stable housed the horses and wagons used to transport goods.
Questions to Consider
Over centuries, humans have altered virtually every corner of the North American landscape. Many of those alterations are inadvertent, byproducts, for instance, of processes of extraction. The landscape also reflects more deliberate alterations. Manipulating the natural environment by digging canals, changing the course of waterways, or other means can promote the efficient exchange of commodities.
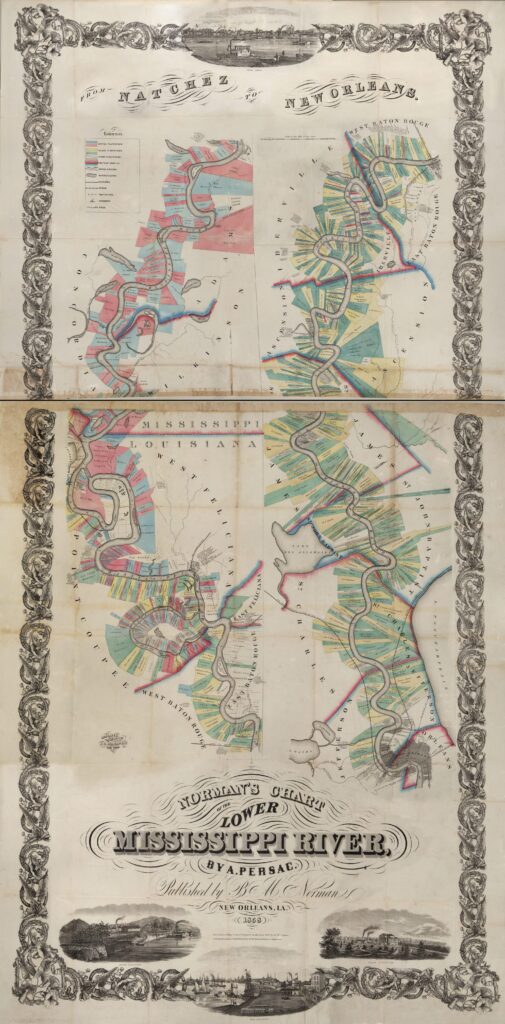
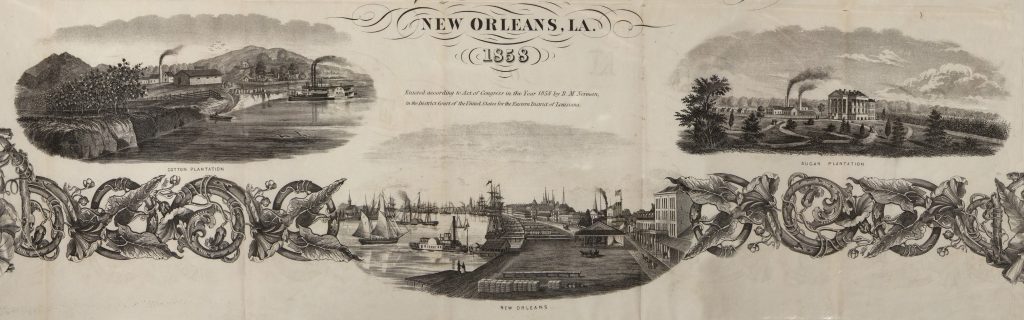
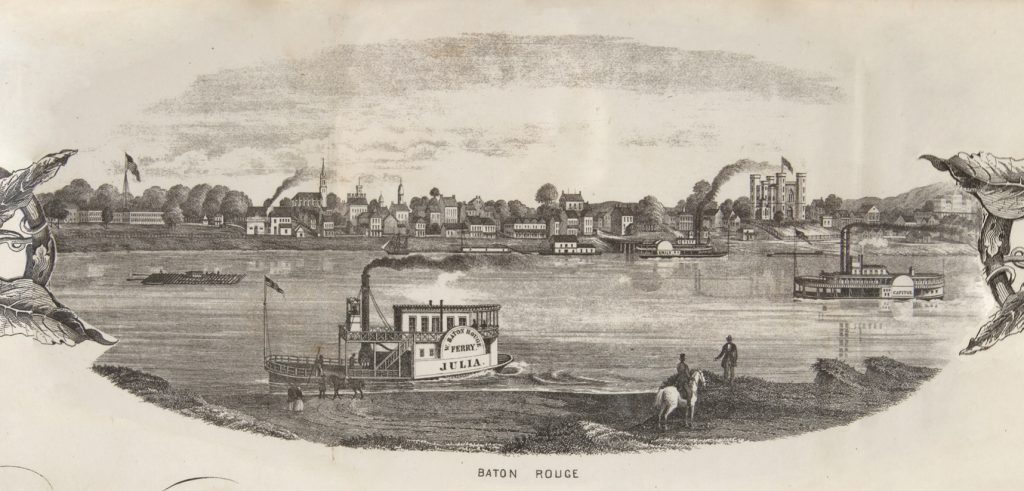
Marie Adrien Persac, a French-born artist and surveyor, consulted parish records and traveled up and down the Mississippi River to gather information for his 1858 chart. Details on the chart, such as the names and owners of each plantation, made it a useful tool for navigating the section of the river north of New Orleans. The chart shows how planters divided the land to aid the cultivation and transportation of two important commodities in the Gulf area of the Southern United States: sugar (shown in yellow and green) and cotton (in blue and pink). Dockside views on top and bottom illustrate the cultivation and distribution of cotton crops in the region. The map also shows how artificial rechanneling of the river had been taking place over the previous century, a process that altered key features of the environment to promote commerce.
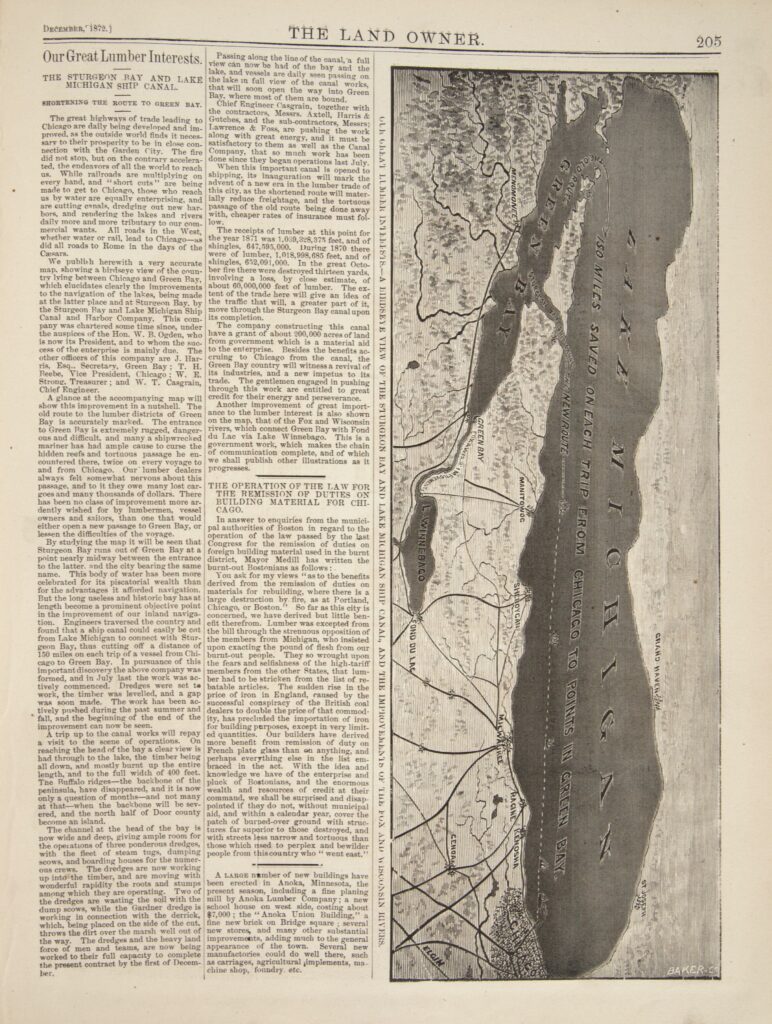
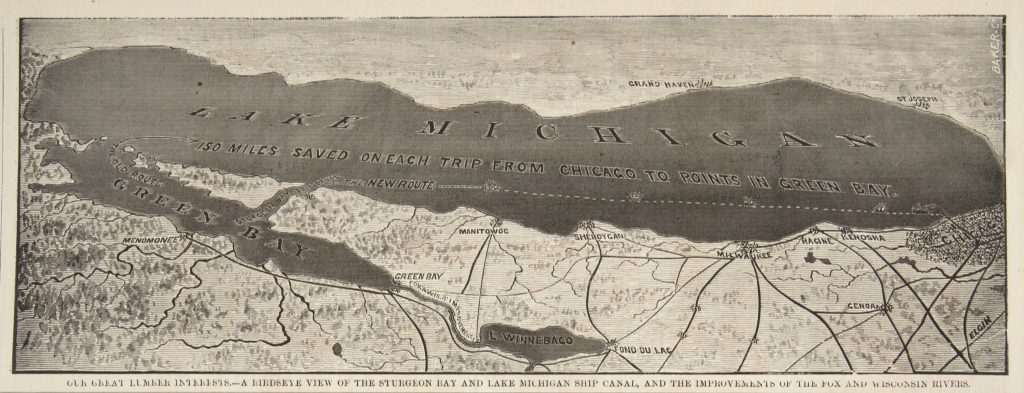
Similar alterations to the landscape were underway on Lake Michigan in the early 1870s. Beginning in the summer of 1872, the Sturgeon Bay and Lake Michigan Ship Canal and Harbor Company dug a canal that shortened the waterborne transportation route between Green Bay, Wisconsin, and Chicago. Proponents of this improvement argued that it offered lumber companies operating around Green Bay a faster, easier, and safer way to get lumber to Chicago markets.
Questions to Consider
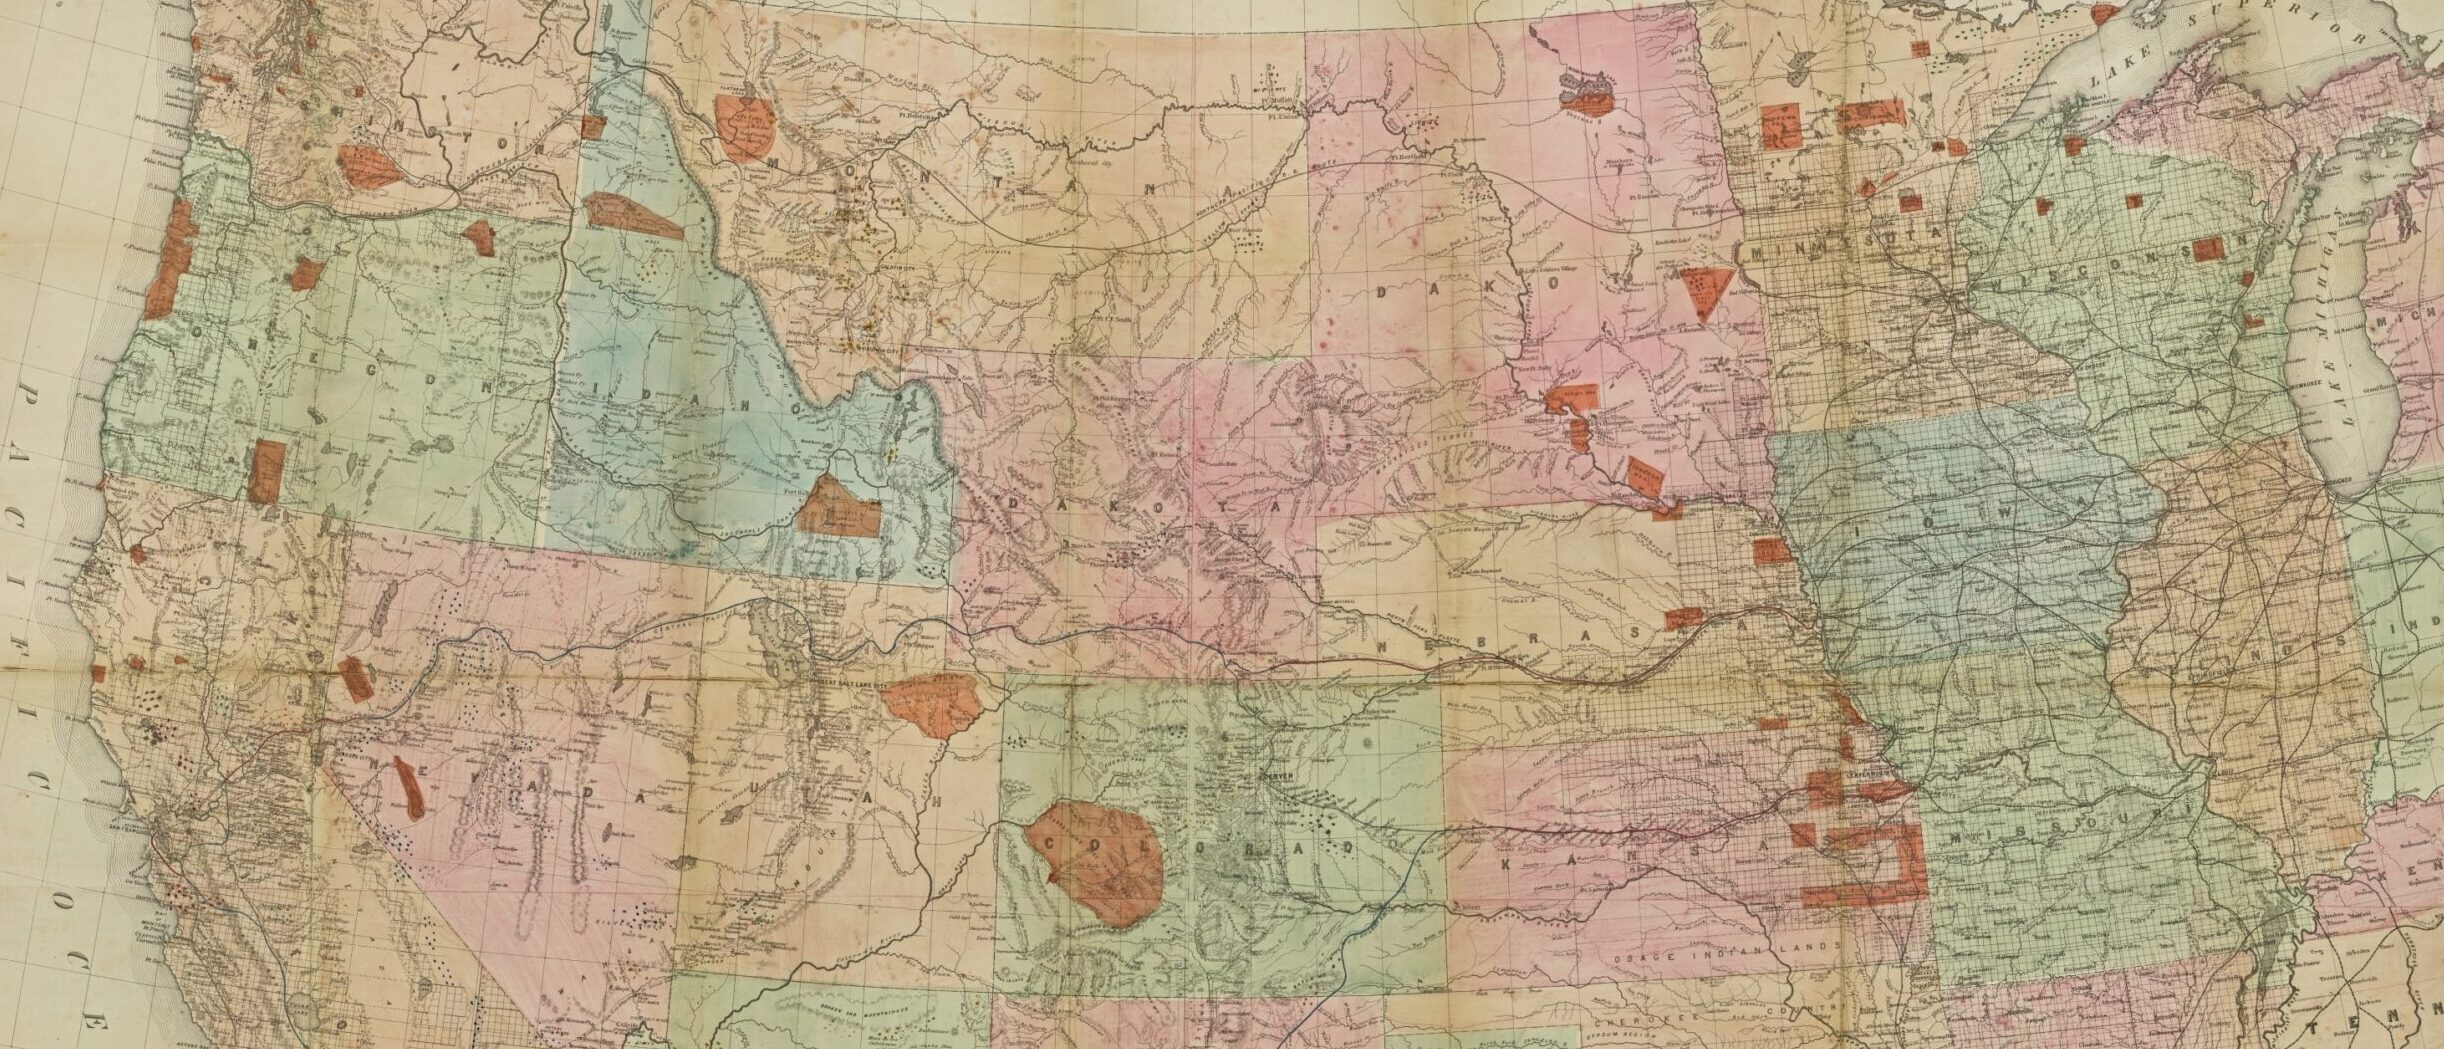
Many accounts of North American history explain the westward expansion of the United States and Canada in terms of each government’s official annexation of territory. Yet commodities—in their extraction, production, and exchange—may offer a different way of thinking about the history of life and work in North America.
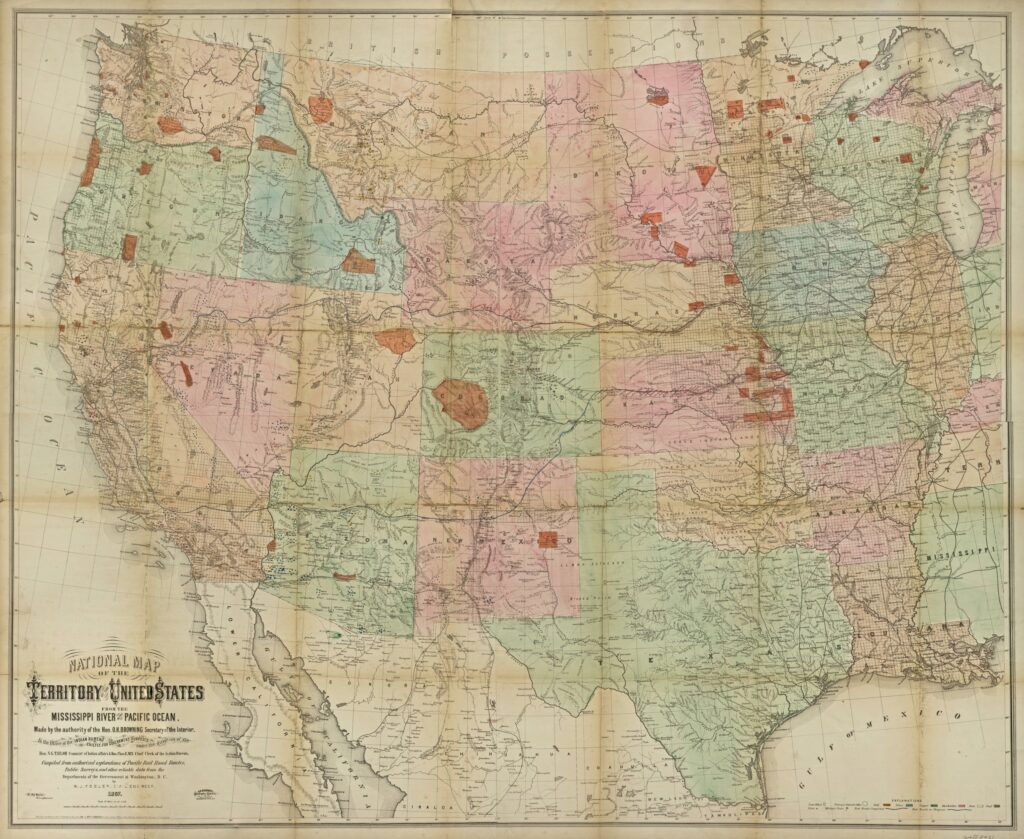
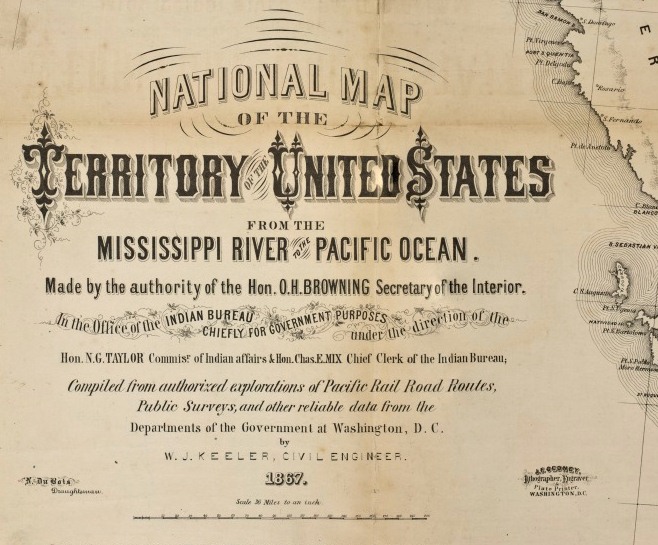
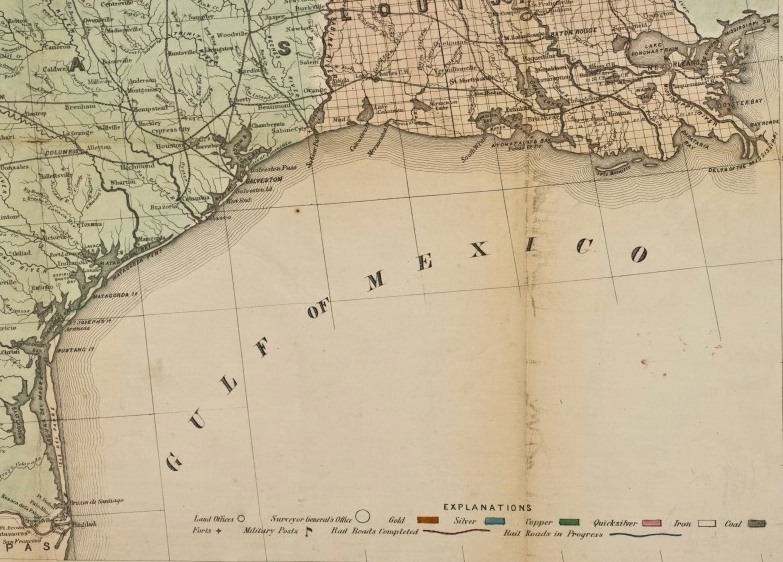
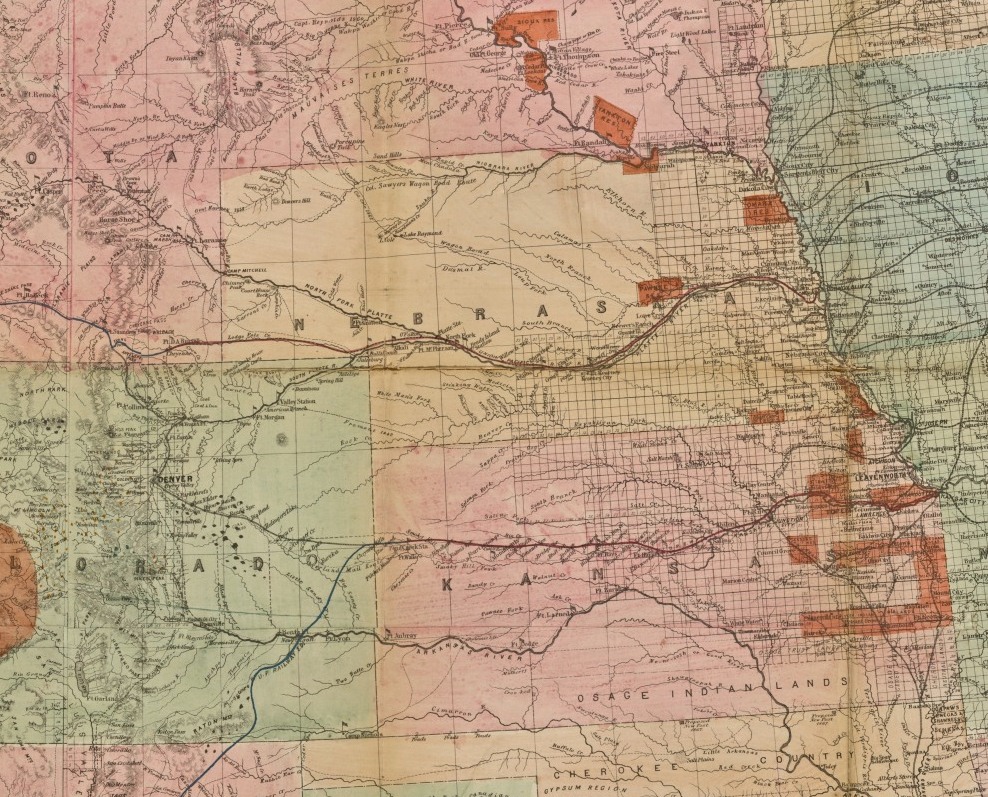
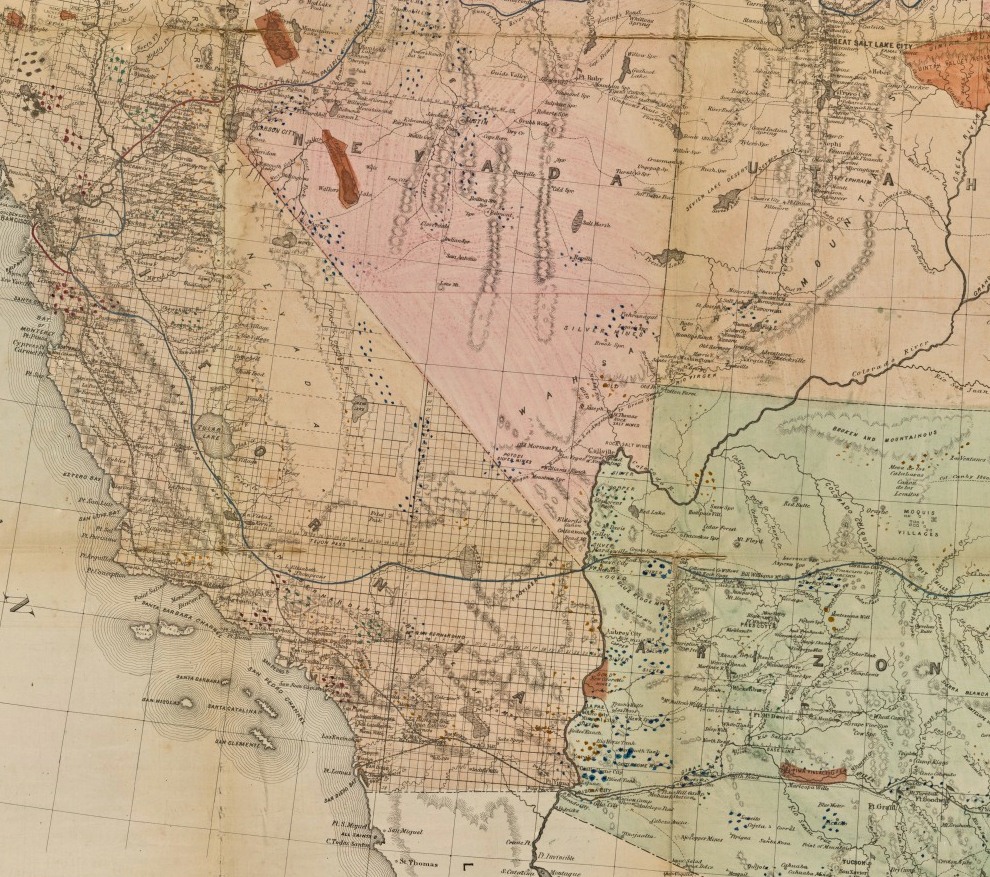
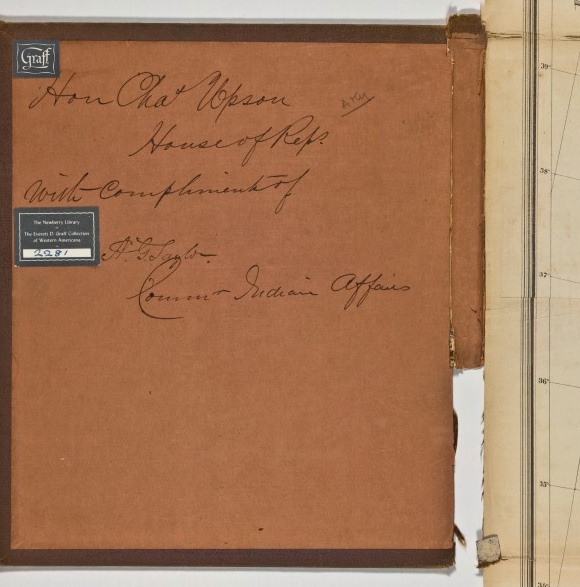
William J. Keeler prepared his 1867 map of the western territories for the U.S. Department of the Interior, the government office responsible for administering federal and indigenous territory. Integrating information from railroad company records, public surveys, and other sources, Keeler’s map depicts the West in great detail. The purpose of this map was the envisioning, planning, and placing of railroads that would link sites of extraction, production, and exchange. In addition to railroad routes, the map shows the locations of township lines, American Indian territories, military forts, and mines for gold, silver, copper, and other valuable metals. The map reveals a continent full of potential commodities, what Keeler described as “new sources of national wealth.” In the process, the map presents itself as a commodity.
Questions to Consider
Aphra Behn’s Oroonoko: Slavery and Race in the Atlantic World
Art and Exploration of the Poles
William Ashworth. The Late, Great Lakes: An Environmental History. Detroit: Wayne State University Press, 1987.
Pierce F. Lewis. “Axioms for Reading the Landscape: Some Guides to the American Scene,” in The Interpretation of Ordinary Landscapes: Geographical Essays. Edited by D. W. Meinig. New York: Oxford University Press, 1979.
Jeffrey Karl Ochsner. “Richardson, H. H.” American National Biography Online. New York: Oxford University Press, Feb. 2000.