

Maps have stories to tell. They may give us a sense of spatial mastery or may appear to capture a place frozen in time but, in numerous ways, they suggest narratives as well. There are histories embedded in each map’s contents (What does the map portray? How does the map portray it? What has been left out?). There are histories in the physical makeup of each map (Is the map hand-drawn or printed? Bound in an ornate volume or scratched on a bit of notepaper?). And there are histories in the circumstances of each map’s creation (Who made the map? For whom did he or she make it and why?). Finally, by comparing different maps to one another, we can trace not only the development of a region or the growth of a city over time, but also the evolution of knowledge about and interest in a given place.
Maps were instrumental in establishing first European, then United States control of North America.
Maps were instrumental in establishing first European, then United States control of North America. For the colonizers, maps provided essential information about natural geography, and the locations of Indian communities and of European military and trading posts. In the nineteenth-century United States, maps became an important instrument of Indian dispossession as the government systematically parceled Indian lands out to white settlers and forced tribes to move onto reservations west of the Mississippi River.
The following collection of documents explores the early history of Chicago and the American Midwest through maps. Chicago developed on land that had been occupied since at least the seventeenth century by many different American Indian groups, including the Myaamia, the Illinois Confederacy, the Potawatomie, Ottawa, and Ojibwe. The French maintained a colonial presence in the region from the 1670s until the end of the Seven Years War in 1763, when France ceded the territory to Great Britain.
The land became part of the United States with the 1783 treaty finalizing the end of the American Revolution, but British people continued to inhabit the region and American Indians controlled most of it. In 1794 the United States defeated the Shawnee and confederated tribes in the Northwest Indian War and achieved greater control of the region between the Ohio River, the Great Lakes, and the Mississippi. Nine years later, the United States Army established Fort Dearborn at the mouth of the Chicago River where it ran into Lake Michigan. The community that developed around the fort was the basis for the city that would develop decades later.
This digital collection is based on the 2007 Newberry Library exhibition and book, Mapping Manifest Destiny: Chicago and the American West, by Michael P. Conzen and Diane Dillon.
Please consider the following questions as you review the documents


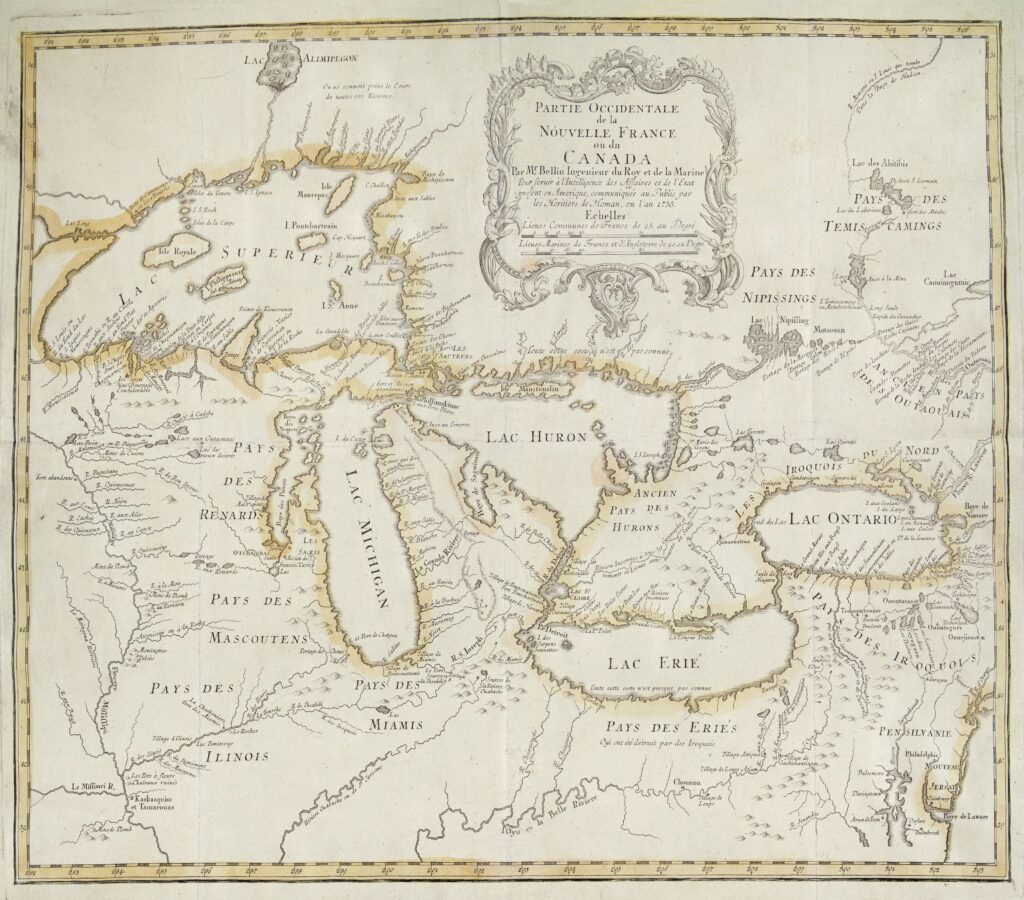
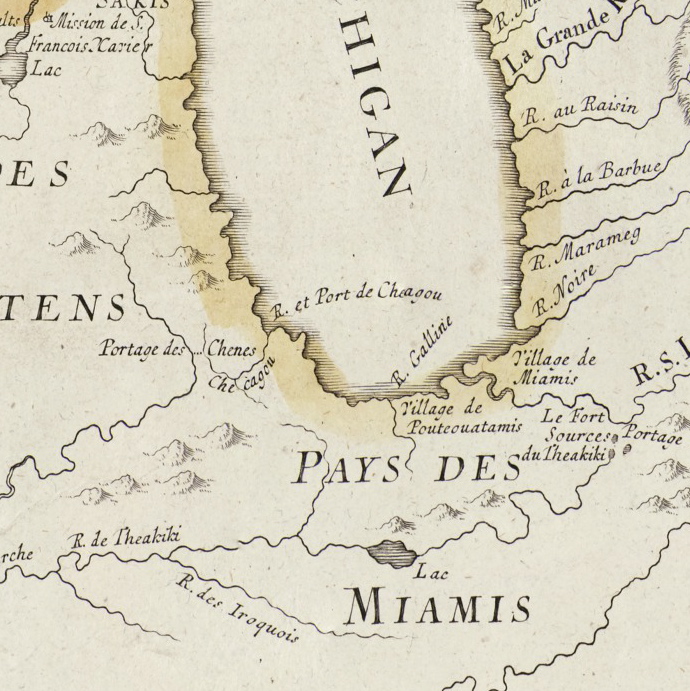
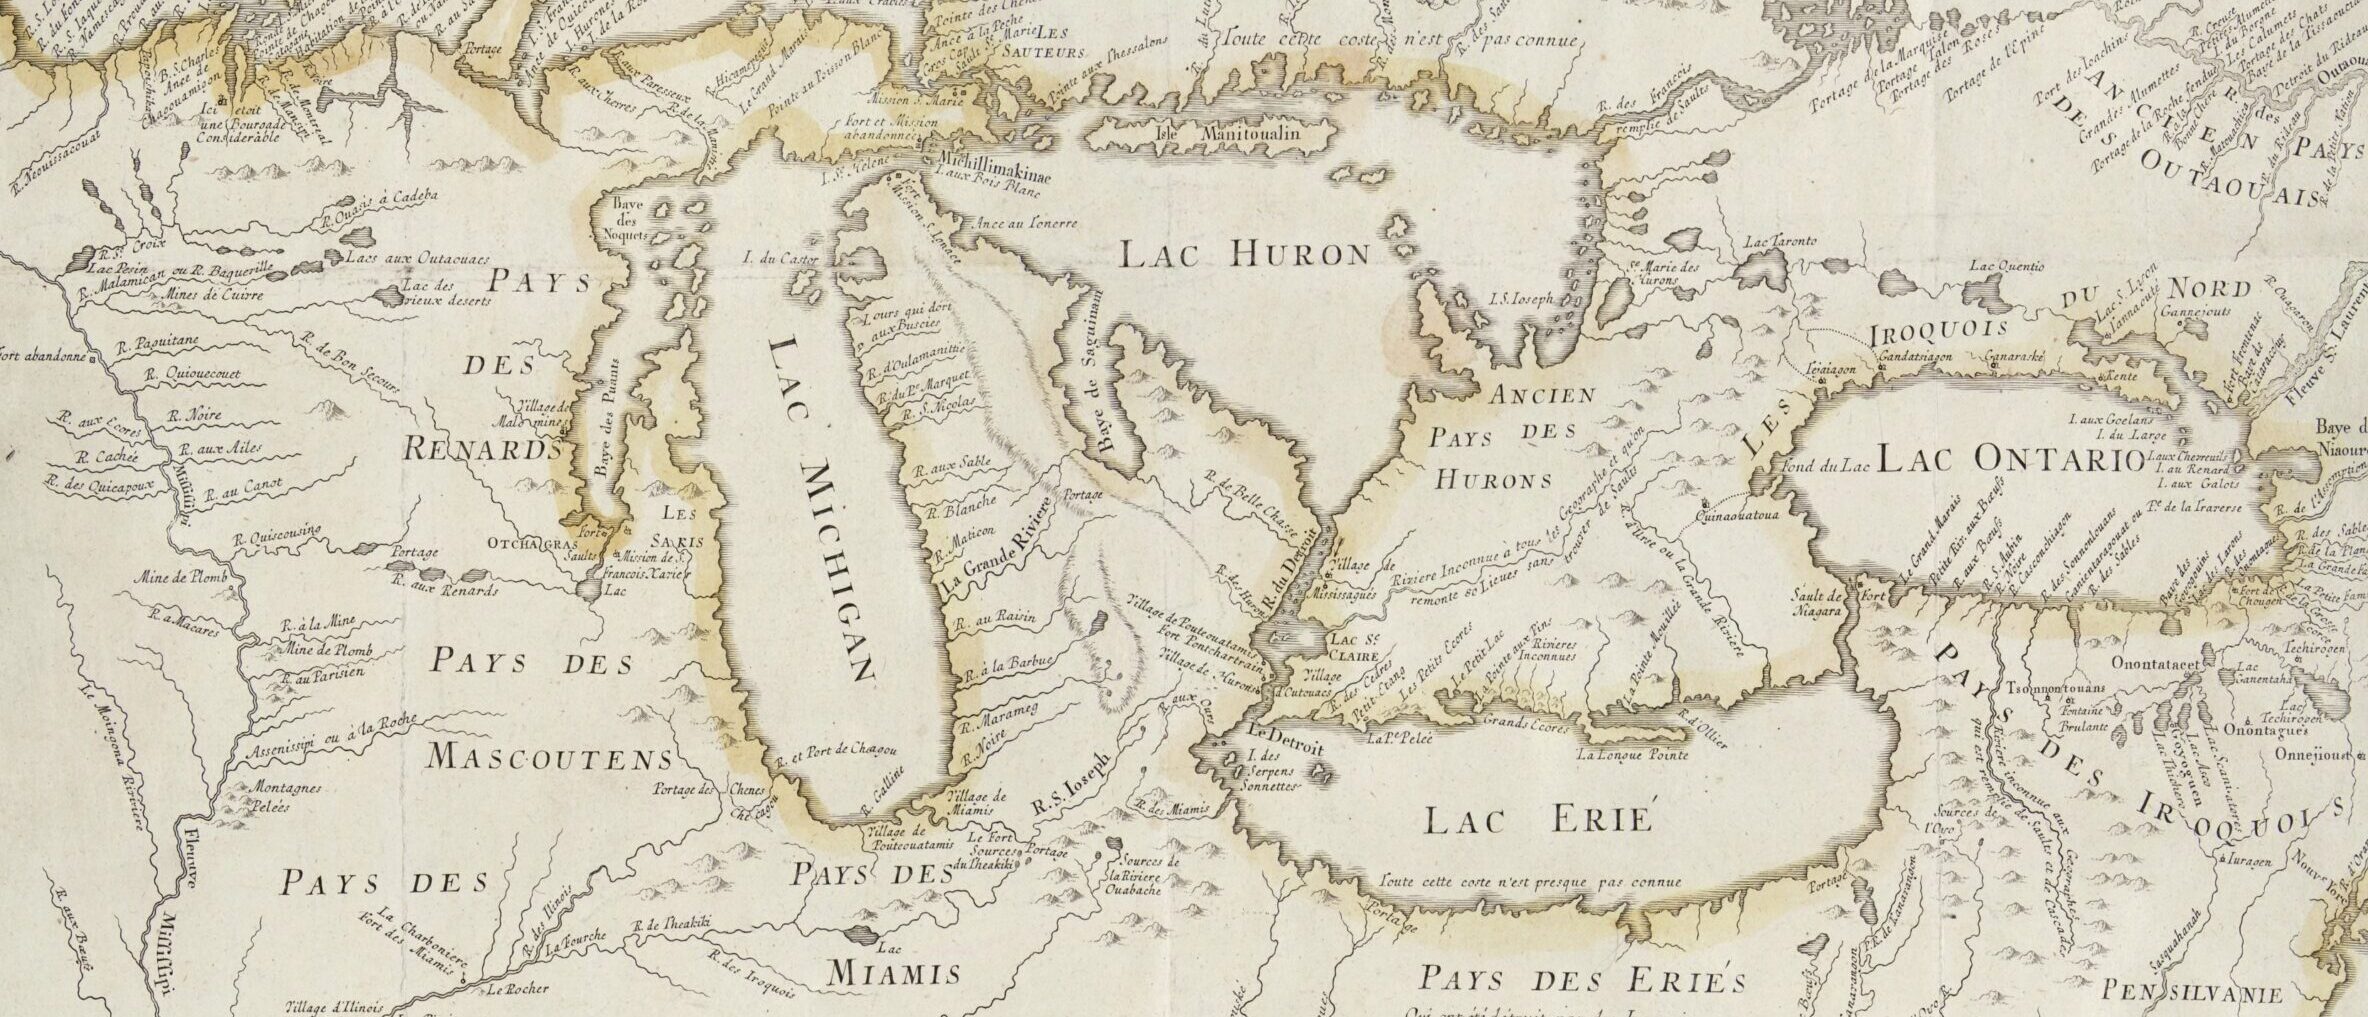
The group of maps in this collection illustrates the early evolution of Chicago as a place worth noting on a map. Chicago first appeared as a place name on a printed map in 1688. Venetian cartographer Vicenzo Maria Coronelli located “Chekagou,” an Indian name, on the eastern edge of his representation of the American West. Although the map was the most reliable one in existence at this time, it contains some striking errors: Coronelli located the mouth of the Mississippi about 600 miles too far west and portrayed California as an island. In the middle of the next century, French cartographer Jacques Bellin included the river and port of “Checagou” in his map of the Great Lakes region in the region then known as New France.
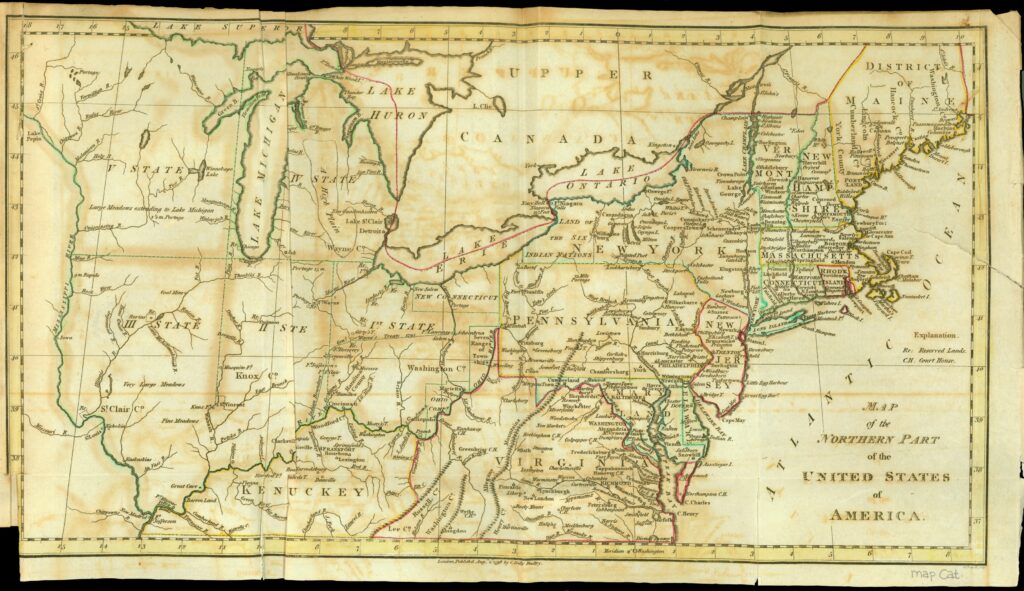
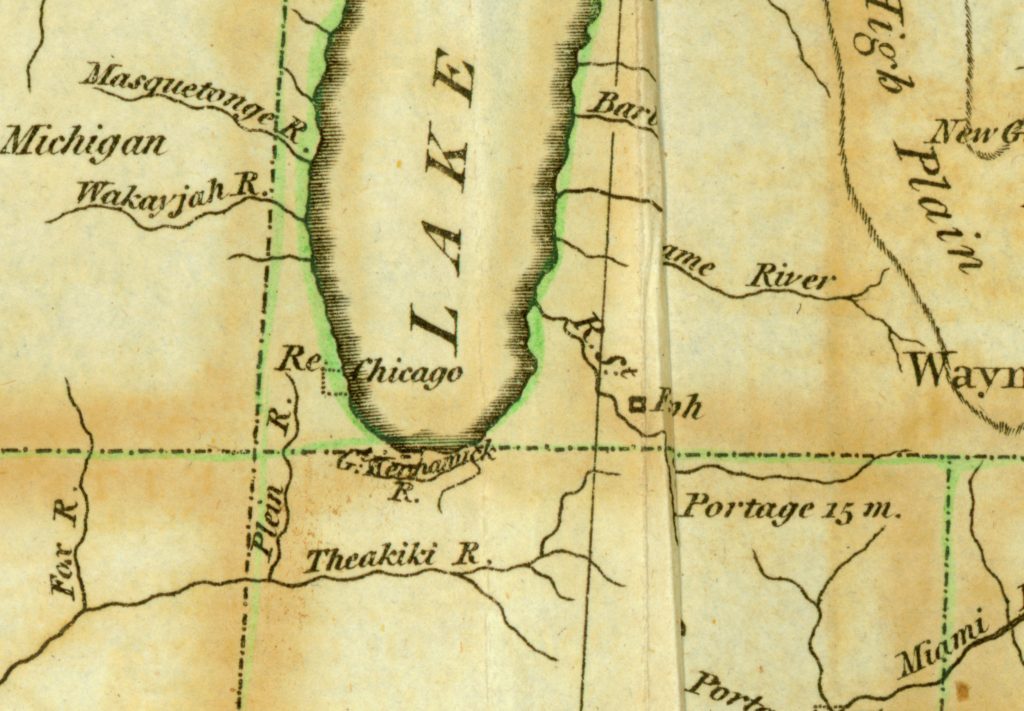
The third and fourth maps below both represent Chicago—spelled as it is today—as part of the United States. Abraham Bradley’s 1798 Map of the Northern Parts of the United States of America situates the place (not yet a city) in the context of the new republic, 16 years after the close of the American Revolution.
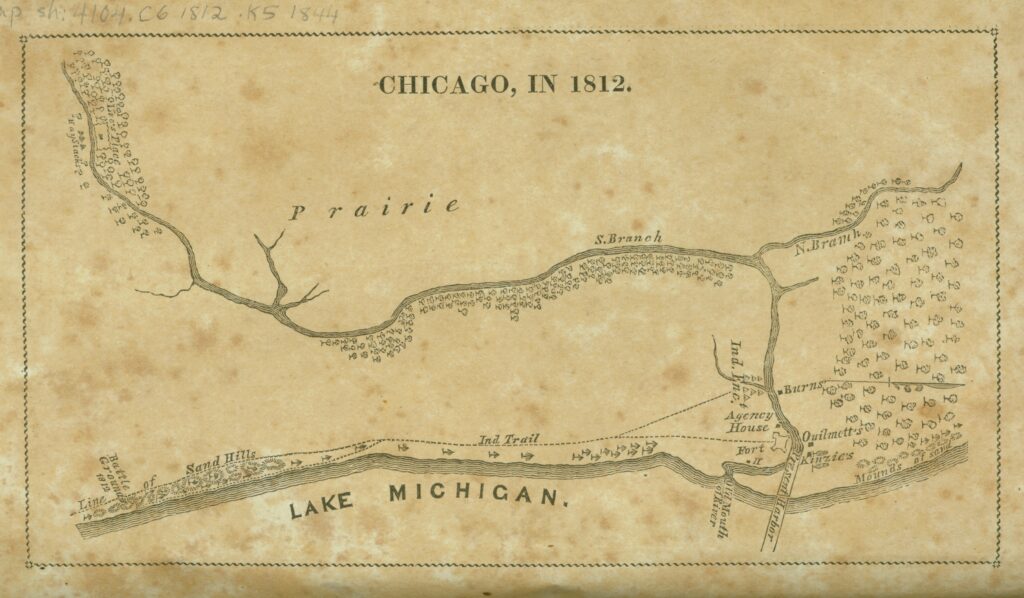
Juliette Augusta Magill Kinzie included Chicago in 1812 as the frontispiece to her 1844 book Narrative of the Massacre at Chicago. At the time of the War of 1812, Chicago consisted of a small number of American soldiers, Indians, Indian agents, French and British traders, and farms clustered around Fort Dearborn at the mouth of the Chicago River. A month after the war began, the American commander of the northwest army decided to evacuate the fort. Indians ambushed the evacuees just a mile and a half outside the fort, killing over 60 Americans and their Myaamia allies and taking 41 prisoners. Kinzie’s father-in-law, John Kinzie, had lived across the river from the fort, trading fur and supplies. She based her map and book on her mother-in-law’s and sister-in-law’s stories about the fort and assault. It was the first map printed in Chicago.
Questions to Consider
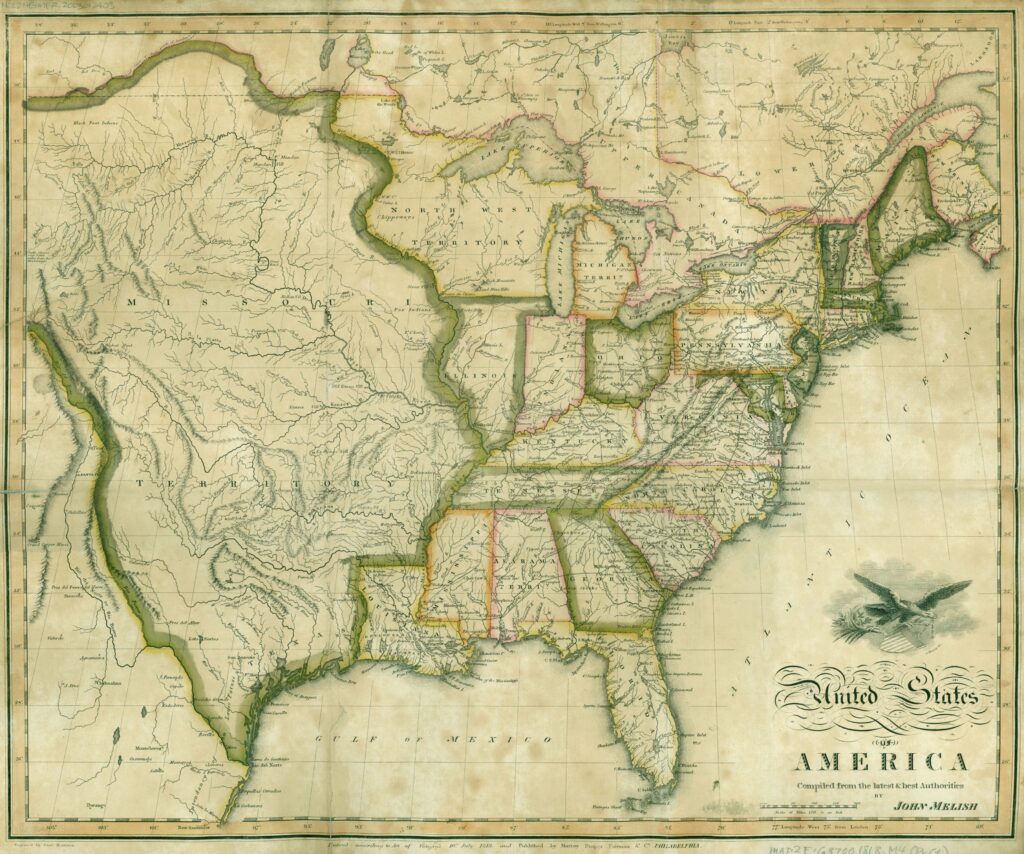
Americans today are accustomed to thinking of most of the states that border the Great Lakes and those that occupy the Great Plains as the Midwest, from Ohio on the eastern side to North Dakota and Kansas on the western side. However, at the time of independence from Britain, Americans considered this region the Northwest. John Melish’s 1818 map of the United States vividly illustrates the country’s development in the first decades after the Revolution and, particularly, in the wake of the Louisiana Purchase of 1803. Melish’s map is aspirational, claiming territory for the new nation that didn’t in fact belong to it. As the map shows, Illinois at this time occupies the western frontier, bordering the Northwest Territory and the vast Missouri Territory. The state’s peculiar shape suggests that the mapmaker may not have had much knowledge of the region. There were few American settlements that far west.
John Mason Peck included the 1831 map, below, in his guidebook promoting settlement of the Mississippi Valley region. Peck was a writer and clergyman who lived in southern Illinois, which was, at the time, more populous than the northern part of the state. He had no financial stake in the region’s development, but seems to have been driven by religious and educational motives.
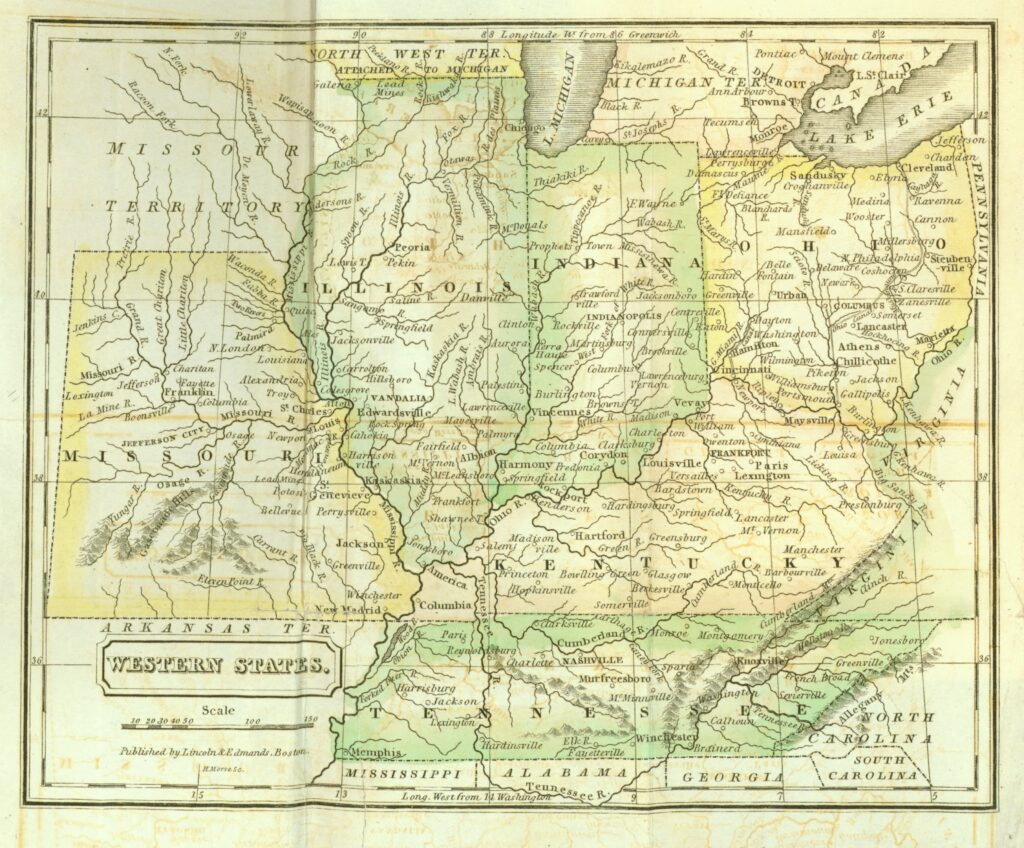
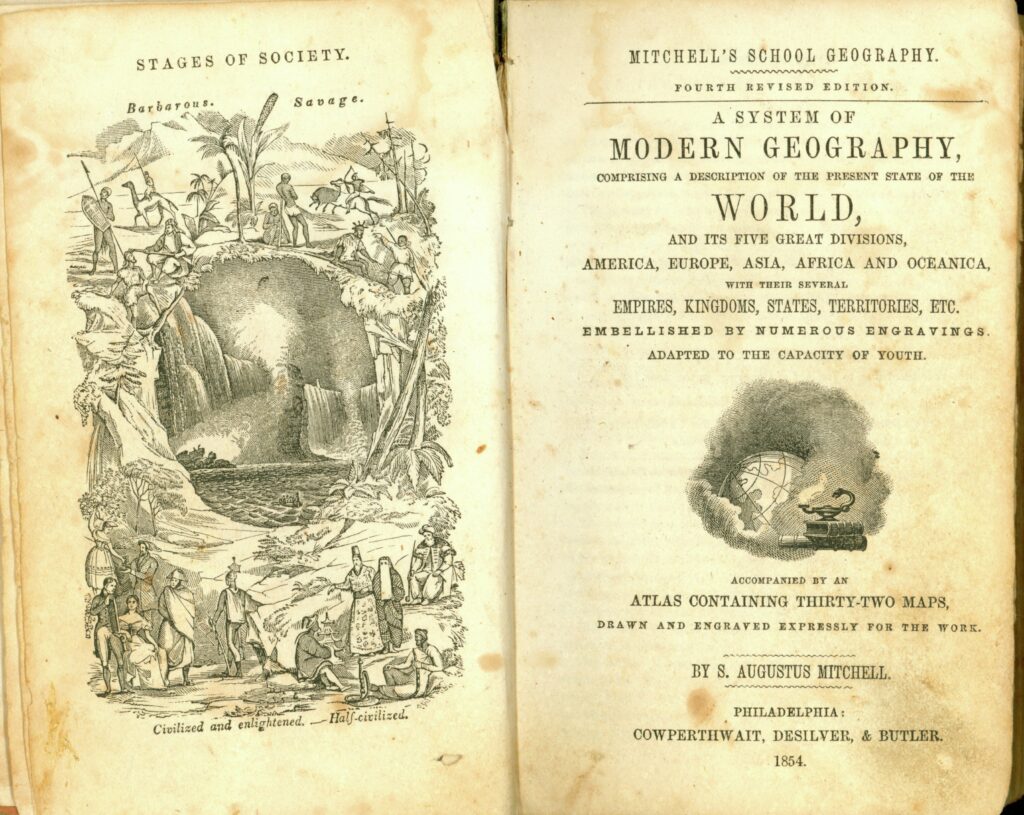
Samuel Augustus Mitchell created A System of Modern Geography to address his own frustration, as a former schoolteacher, with the poor quality of maps and atlases available to him for use in the classroom. His textbook included question-and-answer quizzes alongside the maps. Although Mitchell presents the information impartially, the atlas conveys a strong sense of his assumptions about which regions were important for students to study: The eastern United States receives the most attention. The American West appears as a land of promise for the future. The rest of the world receives brief summaries in the book’s final pages.
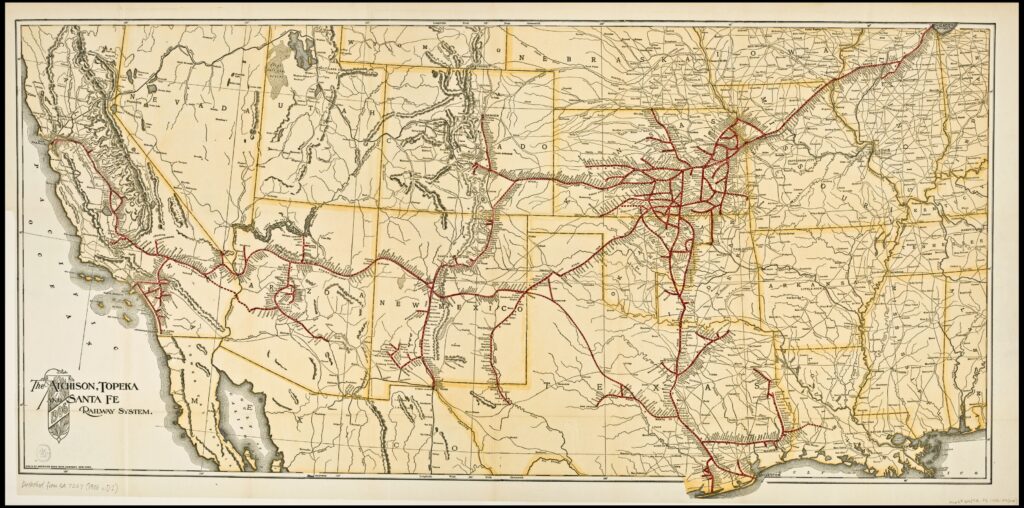
The final map in this section brings us forward in time more than 50 years to the beginning of the twentieth century and suggests the crucial role that railroads played in integrating the nation economically, socially, and politically. The Atchison, Topeka and Santa Fe (ATSF) brought commodities from the Southwest, such as cattle, wheat, and coal, through Chicago to markets in the East. The ATSF also catered to passengers, offering fine dining and comfortable accommodations to travelers across the country.
Questions to Consider
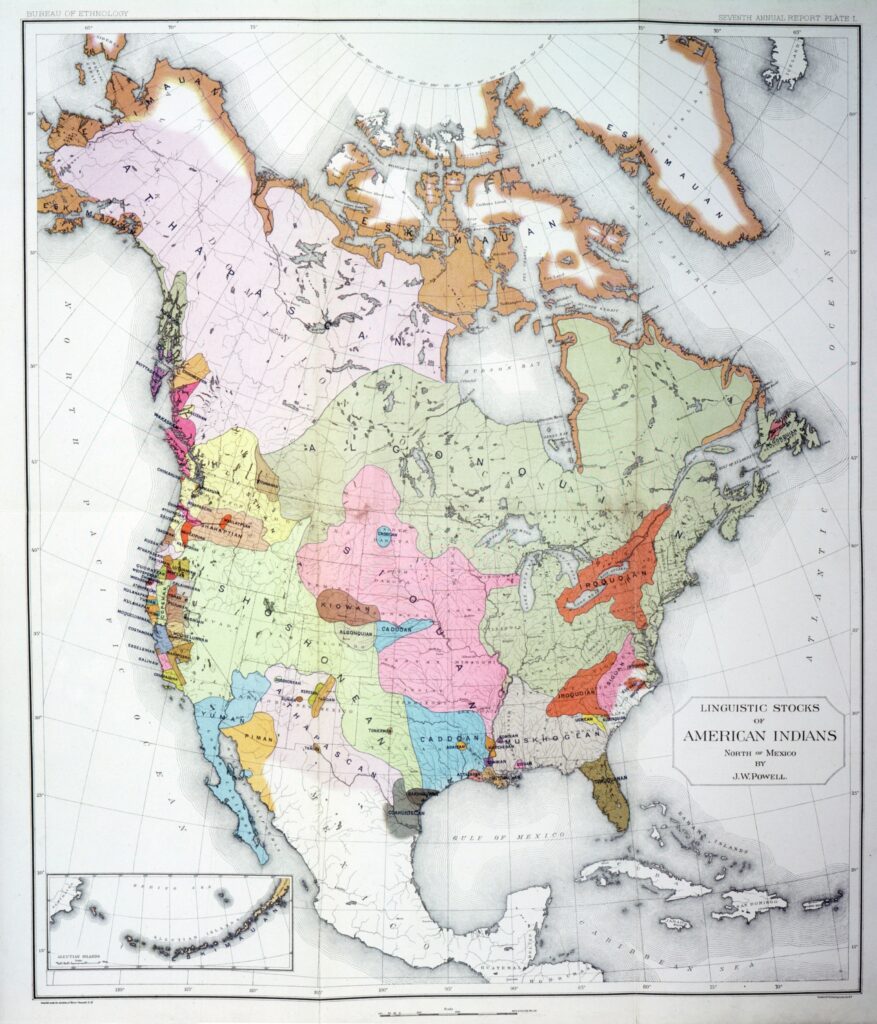
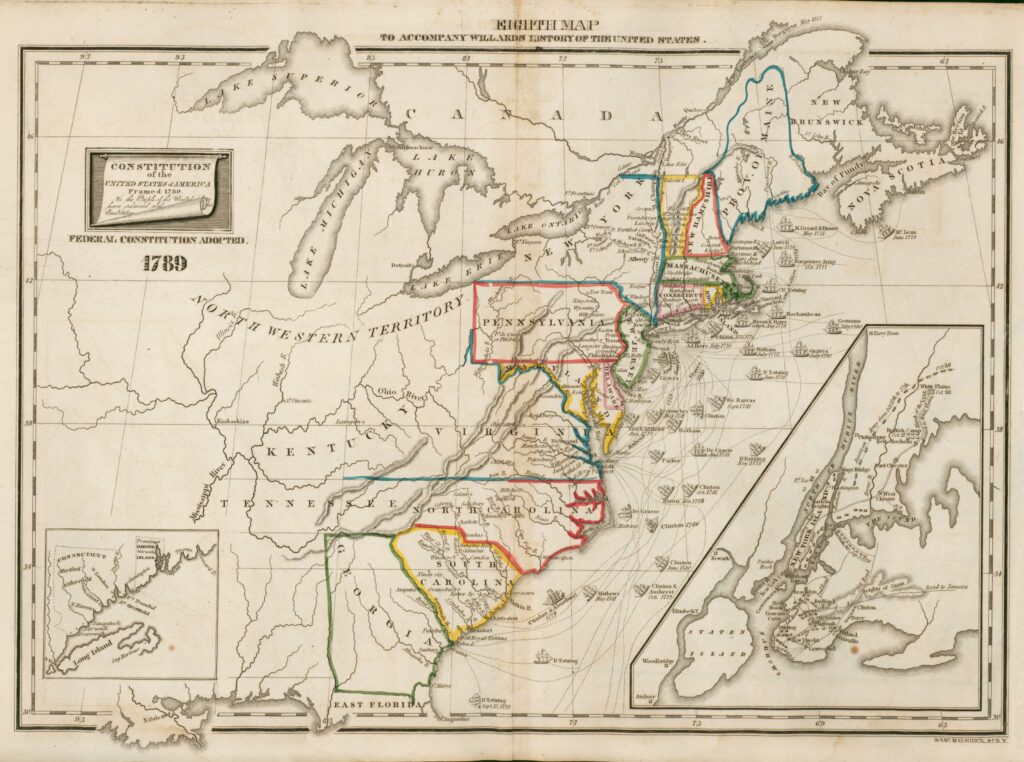
The five maps in this section address, in different ways, the displacement of American Indians from most of the lands they had historically occupied, with particular attention to the Midwest. The first two maps show the diversity and broad geographic reach of indigenous cultures before the arrival of Europeans. John Wesley Powell’s 1891 map shows Indian language families across North America. Educator Emma Willard included Locations and Wanderings of the Aboriginal Tribes in a history and geography textbook. Willard used different colors to show connections between groups, diagramming a complex political and social structure.
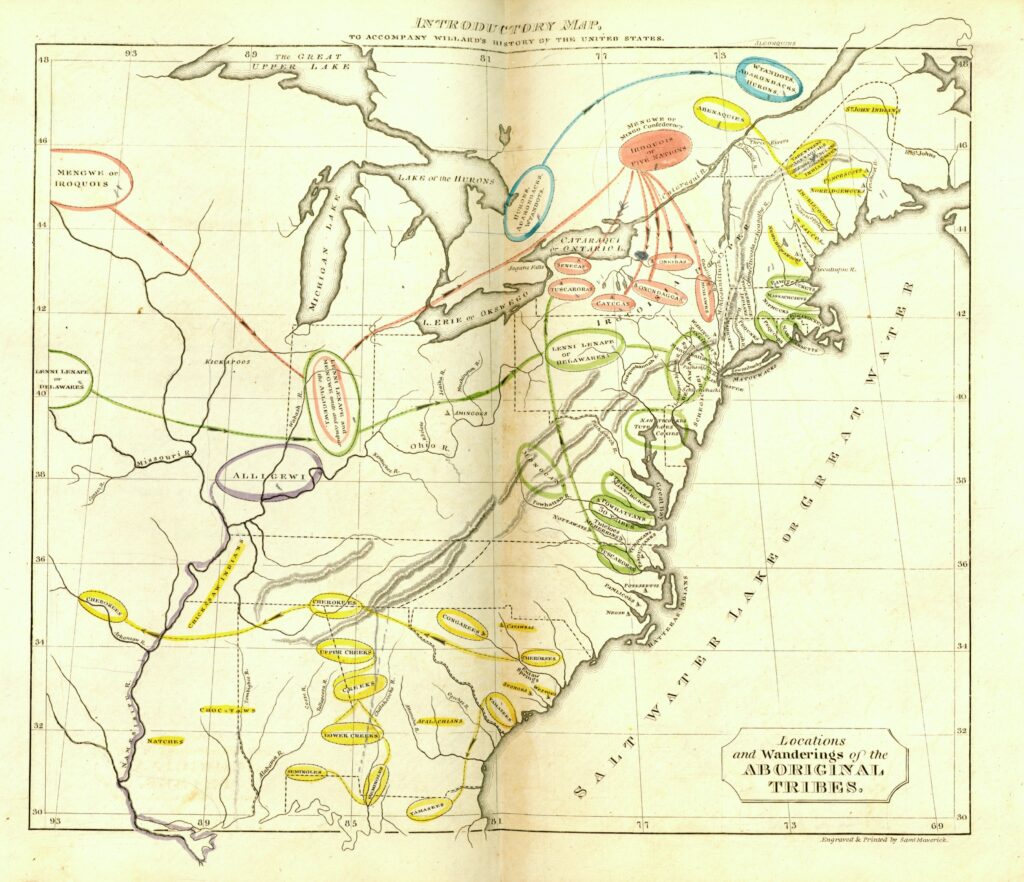
The Aboriginal Tribes map presents a stark contrast to the map that Willard created to represent the United States in 1789 in the same textbook. Here, she effaced almost all evidence of the Indian population. The Western section of the map appears virtually unoccupied, an empty continent awaiting the expansion of the nation.
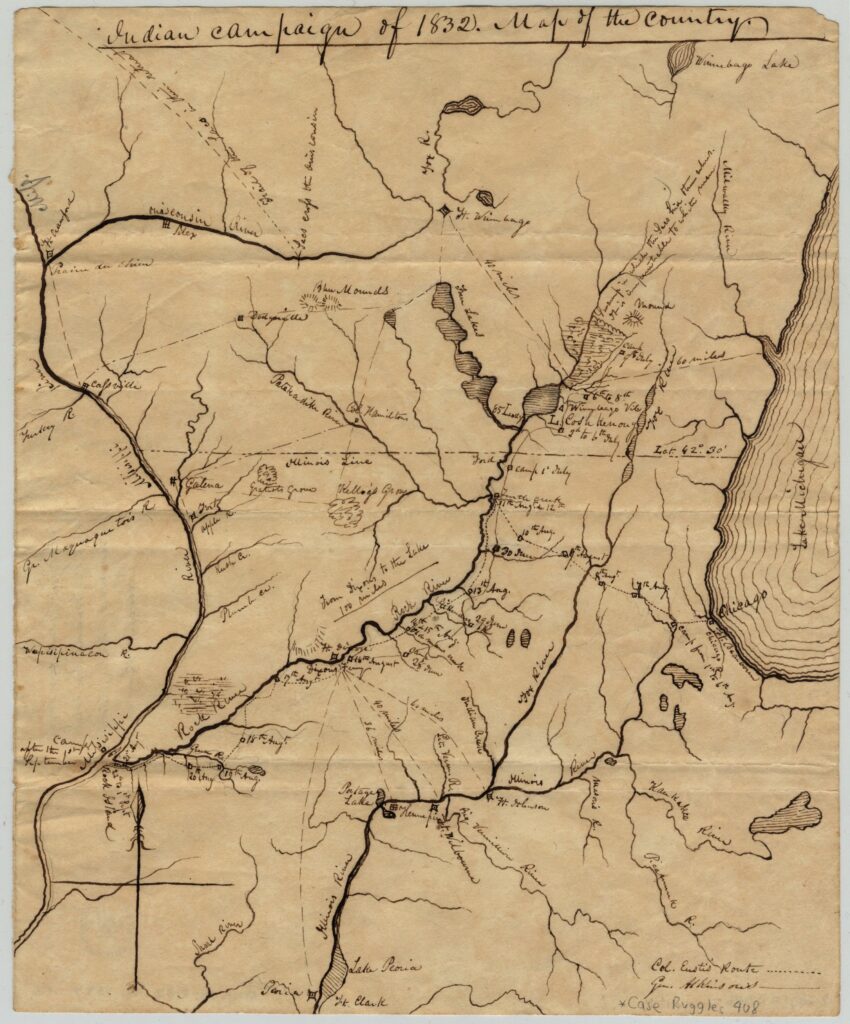
The final two maps by Edwin Rose and R. Jones offer vivid illustrations of how the U.S. government carried out the removal of Indians from the Midwest in the 1830s. The first is a hand-drawn map by Edwin Rose, a colonel in the U.S. Army who participated in the Black Hawk War of 1832. In 1829 the U.S. government ordered Sauk Indians to leave their lands in northern Illinois and southern Wisconsin and move west of the Mississippi River. Most Sauk leaders felt they had no choice but to comply, even as the government failed in its promise to provide sufficient corn for the winter. Black Hawk, however, decided to lead a group of about 1,200 men, women, and children in an attempt to reoccupy their former lands east of the Mississippi and harvest the corn they had planted. In the summer of 1832, the Illinois militia combined with regular U.S. Army troops and attacked Black Hawk’s group with overwhelming military force. Black Hawk and other warriors led the U.S. troops on a circuitous, 16-week chase, while the Sauk women, children, and elderly attempted to retreat back across the Mississippi. The Sauk who managed to reach the Mississippi were indiscriminately massacred as they tried to cross—of the original 1,200, only 150 survived. Black Hawk was forced to surrender. Rose’s map portrays the routes taken by U.S. forces as well as the marshes of the upper Rock River, where the Sauk (here spelled Sac) warriors were based, and their retreat northwest from the Wisconsin River.
The final map, by R. Jones, illustrates how maps were used in the forced relocation of Indian nations to areas in the West following Congressional passage of the Indian Removal Act of 1830. Though many Americans associate removal with the Trail of Tears, which refers to the displacement of southeastern Indian nations, Midwestern nations were also dramatically affected. The Shawnee, Myaamia, Potawatomi, and many other nations were forced to relocate west of the Mississippi.
Questions to Consider
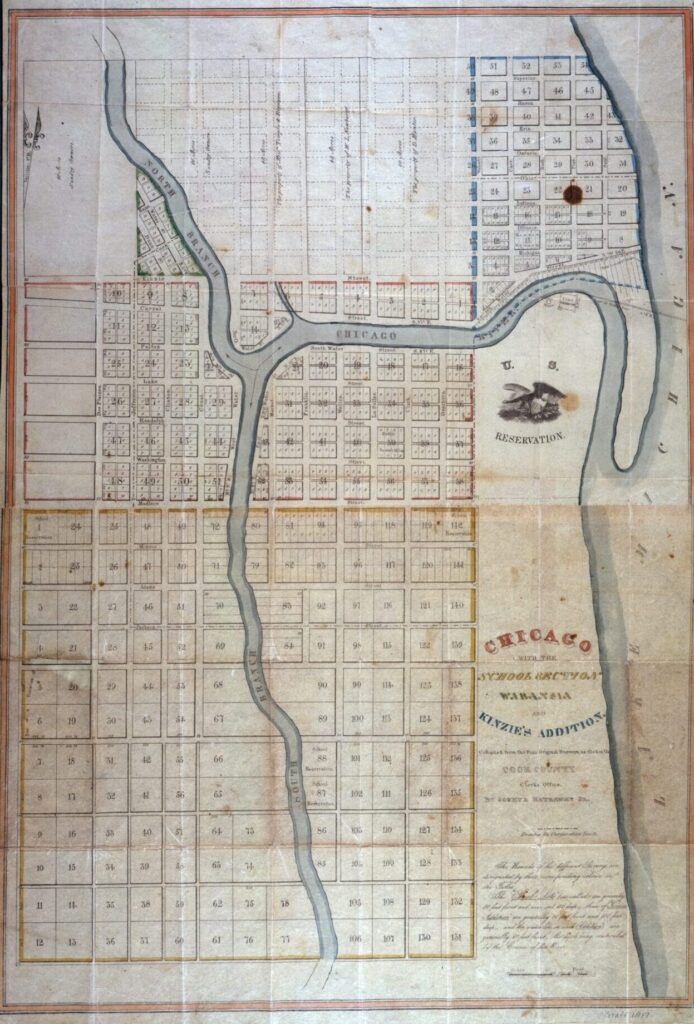
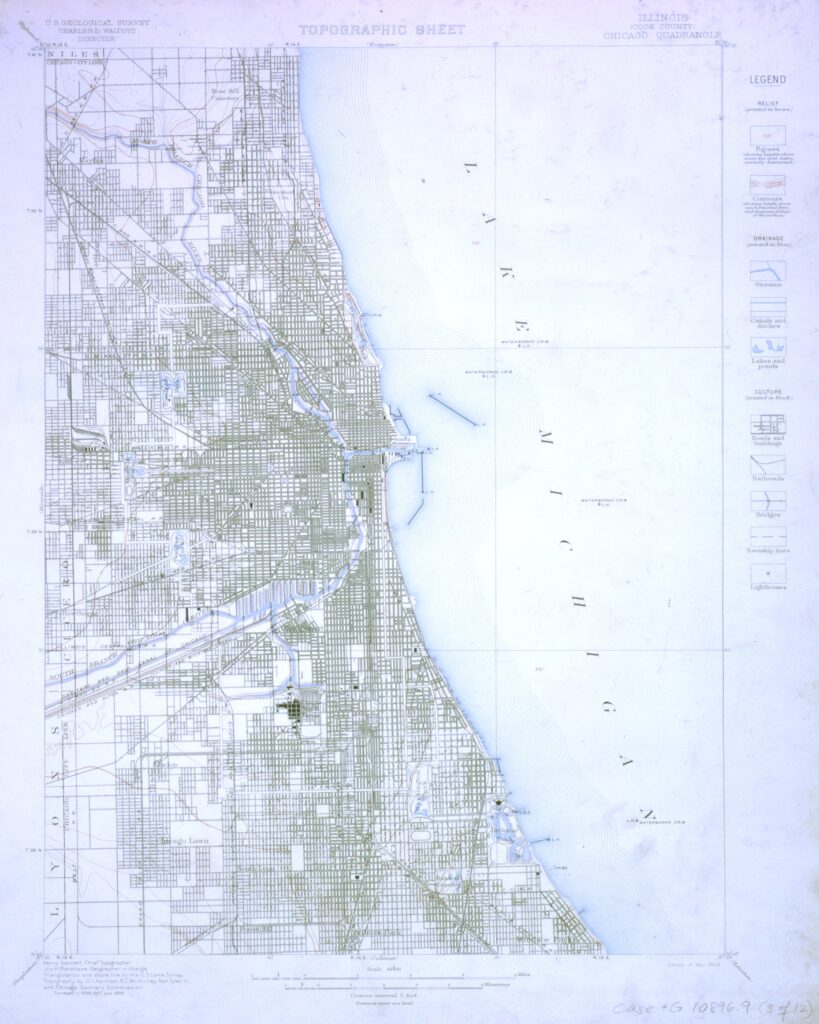
Chicago’s legal boundaries were first drawn in 1830, in preparation for the construction of the Illinois and Michigan canal. And Chicago began its rise from a swampy frontier outpost to the largest city in the interior of the continent. Anticipation of development related to the canal sparked a real estate boom in the 1830s. As speculators divided up the land, John H. Kinzie commissioned Joshua Hathaway to produce this map to facilitate sales. In 1902 the U.S. Geological Survey produced this map illustrating the city’s extraordinary population growth over the previous 70 years. Small rectangles on the map denote individual buildings while bold rectangles indicate blocks that are completely built up.
Questions to Consider
These images illustrate early depictions of Chicago in maps and as a place that was part of the U.S., with each emphasizing different features and perspectives, as well as the transformation of the region from what was considered the Northwest to the Midwest.
These maps capture, in different ways, the displacement and erasure of indigenous peoples from lands that they had historically occupied, with a particular focus on the Midwest.
These maps offer a glimpse into the expansion, population growth, and development of the city.
Conzen, Michael P. and Diane Dillon. Mapping Manifest Destiny: Chicago and the American West, an Exhibition at the Newberry Library. 2007.
Newberry Library. Frontier to Heartland: Four Centuries in Central North America. 2009. http://publications.newberry.org/frontiertoheartland/.
Newberry Library. Indians of the Midwest. 2011. http://publications.newberry.org/indiansofthemidwest/.