Mapping Early America: Peoples, Animals, and Environments

Themes
Colonization
Conquest
Environmental History
Exploration

Periods
17th – 18th Centuries
Early American History

Skills & Document Types
Maps
Visual Literacy

Materials — Available for Download in the Downloads Tab:

Process

Nicolaes Visscher, Novi Belgii Novaeque Angliae nec non partis Virginiae tabula multis in locis emendata per Nicolaum Visscher [New Netherland New England…] (1690)

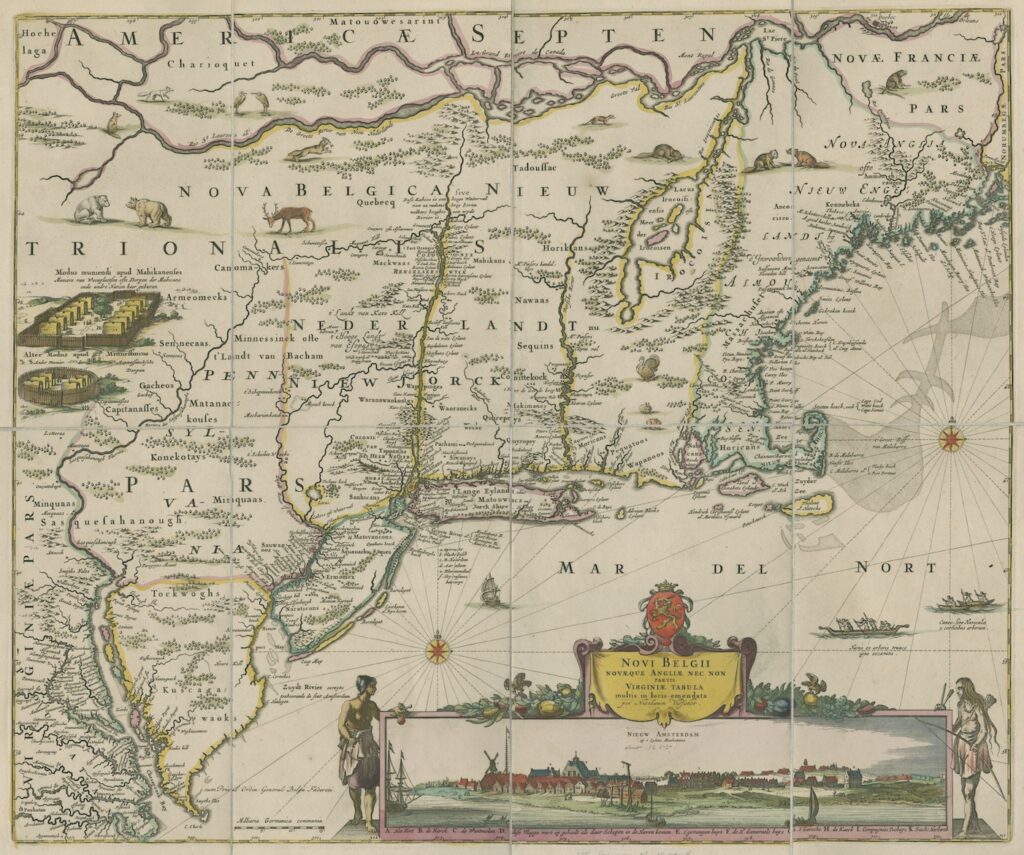
You will look at this map with your students and discuss how it illustrates not just the regions and environment of early colonial America, but also the land’s resources. You will use this map to think about how European maps advanced the imagery of America as a place of abundant natural resources for colonization, as well as how those Europeans depicted Indigenous peoples and communities.

Background information on the map is included in the Background section below.

Activity
  • Divide students into groups of two or three. Give each group a copy of the student handout and, if possible, a printout of the map. Otherwise, you can show an enlarged image on the projector so that students can see. They might need to walk up to the screen at various points to look at the details.
  • Have the groups make a list of as many animals, types of people, buildings, and notable objects that they can see on the map. Have them try to find and name all the animals they can.
  • Come back as a class and discuss their findings. Try to point out on the map in front of the class what they name.
Questions for Discussion
  • Why do you think the mapmaker placed those particular types of animals on the map? Are they just decoration, or do they serve a purpose? What might that purpose be?
  • Why might Europeans want to know what animals were in these regions? What might they do with this information?
  • Analyze the images of the People of the Waters That are Never Still depicted alongside the cartouche and the canoes with the animals. Why do you think the mapmaker included images of Indigenous people on the map? (Potential Answers: It reminds Europeans that there are Indigenous people in the Americas, too. It speaks to the curiosity of readers who might want to know what these people might look/be like, though they are not necessarily accurate depictions of local Indigenous people or their clothing.)
  • How are the Indigenous villages depicted? What do they look like?
  • How are the Indigenous villages different from New Amsterdam (pictured in the cartouche)? (Potential Answers: Students might point out the circular and square fences around the Indigenous villages, which are absent in New Amsterdam. New Amsterdam is on the water, with ships near the shore, indicating trade, new arrivals, etc. New Amsterdam has structures that would be familiar to Europeans, like houses, windmills, flags, gallows, churches, multi-story buildings, while the Indigenous villages have neatly rowed, one-story structures, called wigwams, that a European viewer would likely consider strange or less advanced. Note that this is not necessarily what the villages looked like, just how they were described by the European cartographers.)
  • Based on what we talked about, what do you think these maps were for? What kinds of messages could they communicate to Europeans looking at them? (Potential Answers: The map reinforces the idea that the Americas were a place with natural resources, food, and animals that might be useful to Europe. Shows Europeans what types of animals they might encounter, whether as predators, food sources, or sources for the fur trade. it reminds Europeans that Native peoples also lived in the region.)

Background

This is a Dutch map from approximately 1655 depicting the northeast of North America, spanning from Canada to Virginia. It depicts animals like bears, turkeys, birds, beavers, deer, foxes, and rabbits, an Indigenous village, and Indigenous people in boats. The cartouche in the lower right-hand side of the map depicts New Amsterdam. By this period, more maps included animals and natural resources to encourage colonization, trade, and investment in the Americas. Maps also included images of Indigenous peoples, in this case the Mohican peoples, or People of the Waters That are Never Still, Algonquian-speaking peoples Native to parts of what is now New England and New York. Maps might also include pictures of Indigenous villages, and, occasionally, predatory animals to inform readers about potential obstacles, dangers, or opportunities in these regions. This activity is intended to help your students realize that colonial maps were not just about getting around, but about what people could encounter on their travels.

Extension Activity

Apply this analysis strategy to other early European maps of North America:

Words to Know

Cartography | The science and practice of drawing and making maps

Cartouche (kar-TOOSH) | A decoration on a map or globe, contained within a box, a circle, or a seal, that can add artistic, symbolic, or written narrative detail to a map. They became popular in the sixteenth century and remained prominent decorative features on maps into the nineteenth century. Map cartouches might include details like titles, printer information, dates, or imagery.

Mohican | A name that refers to the peoples that lived, prior to European colonization and US removal, near the Mahicannituck River (now called the Hudson River). These peoples called themselves Muh-he-con-neok or, “The People of the Waters That are Never Still.” They are now commonly referred to as Mohicans. Mohican people still live today in vibrant communities such as the Stockbridge-Munsee Community. Learn more about their histories and their ongoing presence in the United States here.

About the Author

Danielle Alesi is an Assistant Professor at Nazareth University in Rochester, New York. She teaches classes on Renaissance and Early Modern, Atlantic World, and Environmental History and conducts research on colonization, animals, and food in the early modern Atlantic World. Danielle previously worked on maps at the Newberry Library as a fellow in the 2022 National Endowment for the Humanities Summer Institute Mapping the Early Modern World.

This lesson supports the following Illinois State Board of Education Social Science Standards:

Evaluating Sources and Using Evidence:

  • SS.3-5.IS.4. Gather relevant information and distinguish between fact and opinion to determine credibility of multiple sources.
  • SS.6-8.IS.2.LC. Determine the value of sources by evaluating their relevance and intended use.

Geography:

  • SS.5.G.1. Use print and digital maps of different scales to describe the locations of cultural and environmental characteristics.
  • SS.5.G.2. Investigate and explain how the cultural and environmental characteristics of places within the Unites States change over time.
  • SS.6-8.2.LC. Explain how humans and their environment affect one another.
  • SS.6-8.3.LC. Explain how environmental characteristics affect human migration and settlement.

Download the following materials below:

Related Newberry Resources:

Indigenous Chicago Project Thumbnail
Indigenous Chicago Curriculum

A custom curriculum hosted by the Newberry and centered on Chicago as a Native Place.

Created in alignment with Illinois State Standards and to support the HB1633 mandate to teach Native history.