

This collection offers related visual literacy exercises (grades 3-5), a unit plan (grades 6-12), Document-Based Questions, and C3 Framework activities (grades 9-12). Please refer to the Related Resources section linked above.
Thousands of surviving maps allow scholars to trace how European and Indigenous understandings of North America developed between the sixteenth and eighteenth centuries. These maps convey information about the continent’s physical features, practical details ranging from the contours of rivers and coastlines to the locations of settlements. Yet as experts on cartography remind us, maps are never straightforward geographic records. Maps produced between the sixteenth and eighteenth centuries thus outlined more than North America’s physical shape. During the formative centuries of European exploration, cross-cultural encounter, and colonization, maps played an essential role in the process of transforming North America into a new world populated by American Indians, Africans, and Europeans. While drawing and redrawing maps of the continent, imperial domains, colony boundaries, or individual homesteads, early Americans defined the political, economic, and cultural shapes of colonial North America.
The documents in this collection include maps of varying styles and purposes made by the diverse peoples that created colonial North America. Together, these documents illustrate the utility of maps as historical sources and, more specifically, illuminate colonial North America’s multicultural and contested origins.
Please consider the following questions as your review the documents:
Colonial North America encompassed more than British colonies on the East Coast. Mapping North America was a collaborative enterprise. To form a complete picture of the continent, European cartographers had to synthesize information from numerous sources. That task proved especially challenging because many cartographers worked in major European cities like Amsterdam and never saw the territory they mapped. In the absence of their own first-hand knowledge, cartographers drew from existing maps as well as the sketches and reports of explorers. For their part, explorers frequently derived much of their knowledge from American Indians. As the following documents demonstrate, the process of synthesizing information from such an array of sources enabled cartographers to produce increasingly detailed and accurate maps. Yet the same process could also perpetuate misinformation.
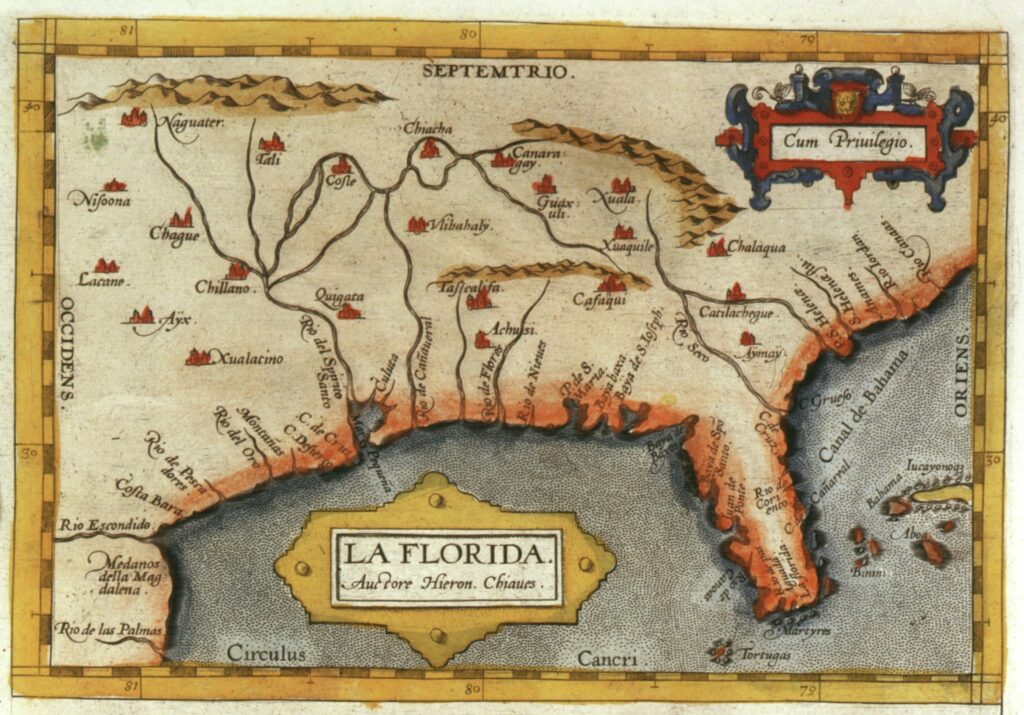
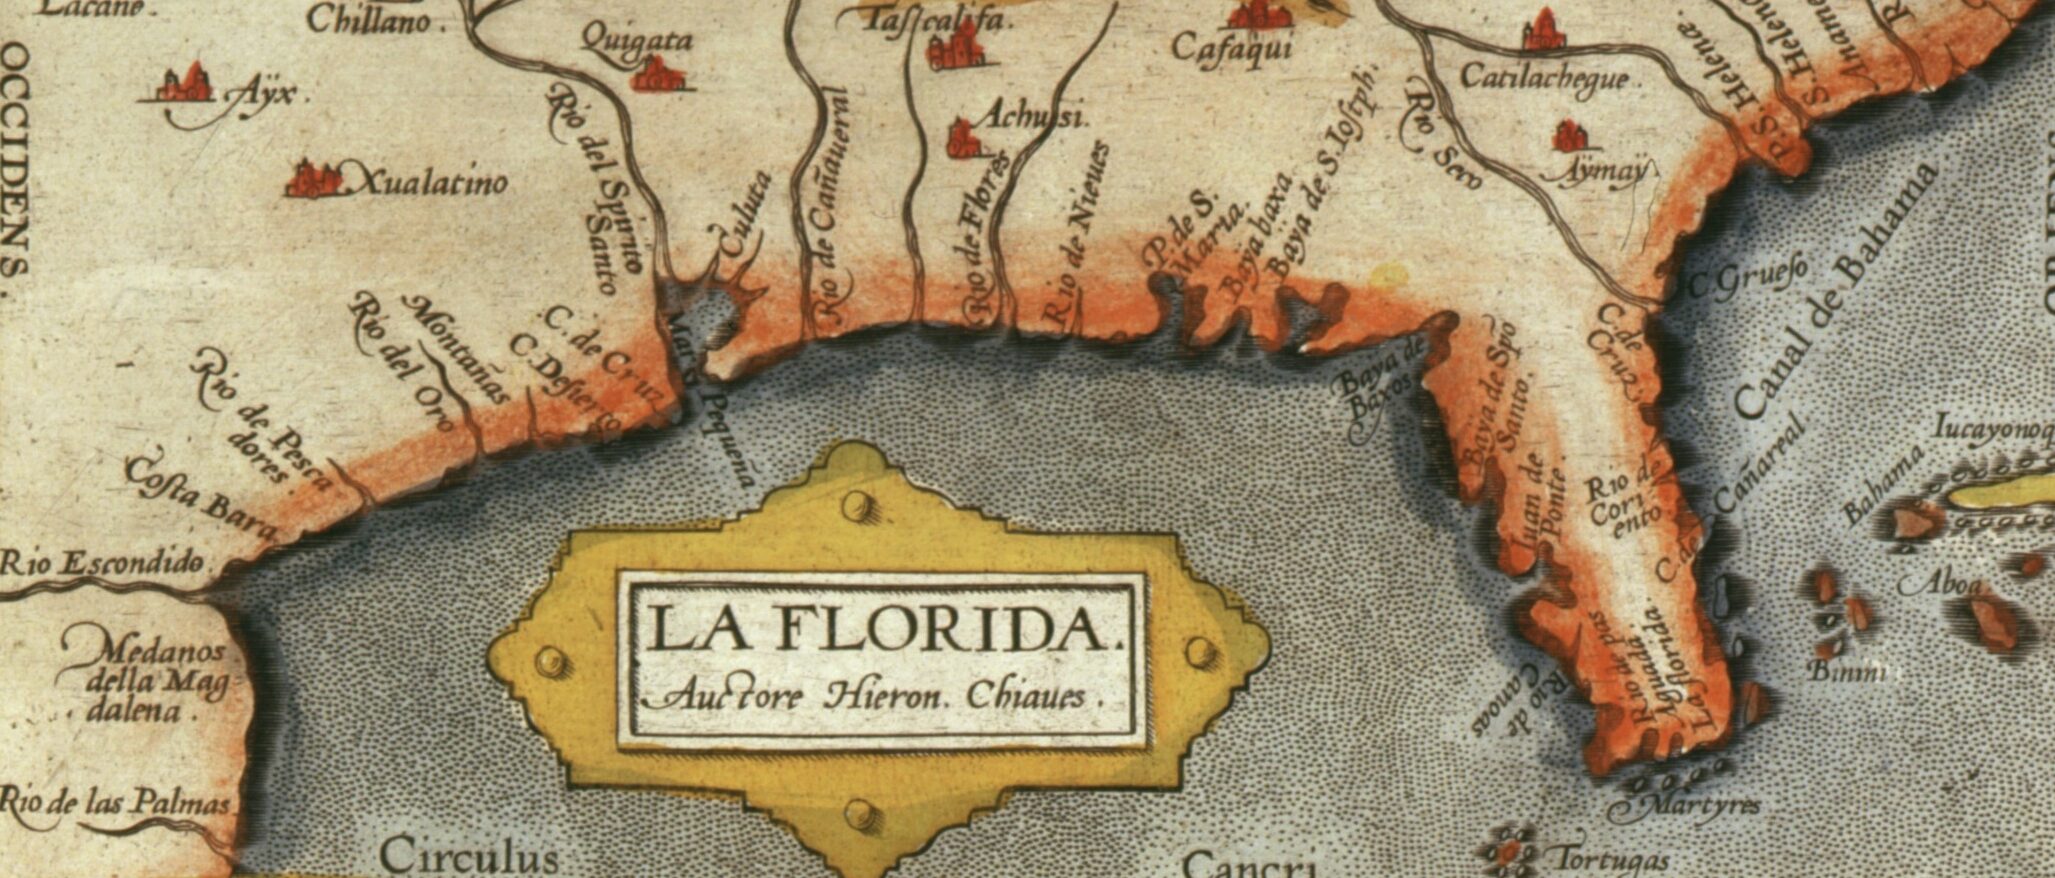
Geronimo de Chaves’s map of Florida, published in the 1584 edition of Abraham Ortelius’s world atlas, offers a rare example of sixteenth-century Spanish cartography. For much of the colonial period, the Spanish government forbade cartographers from publishing maps of the Americas for fear that the information they contained might benefit rival European states. Chaves, one of Spain’s royal cosmographers, never visited Florida. Instead, the names and locations of Indigenous settlements on the map suggest that he relied on a published account of Hernan de Sotó’s explorations.
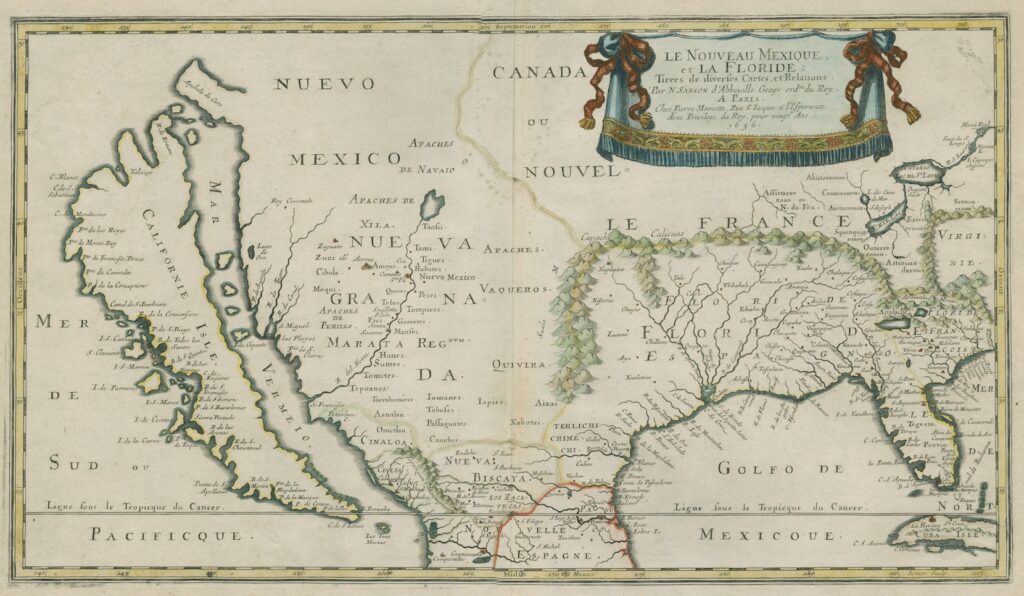
Nicolas Sanson, royal cartographer to the French King Louis XIII, integrated elements of Chaves’s map into his later map of New Mexico and Florida. When it was published in 1656, this map combined the best information of the American Southwest then available in Europe. Sanson rose to fame in the seventeenth century because of his commitment to geographic accuracy; unlike some of his peers, he insisted on using only information verified by multiple sources. The sources Sanson relied on while making this map convinced him that California was an island off North America’s West Coast—an error the map and his reputation for accuracy reinforced.
Questions to Consider
The maps in this section appear in the Document-Based Questions for this Collection and the Unit Plan Grades 6-12.
In contrast to our own more definite ideas about the structure and function of empires, the Europeans who colonized North America between the sixteenth and eighteenth centuries had yet to agree on the form colonies should take or the relationship they would have with their founders’ home countries. The documents below provide insight into the different ways European states employed cartography in their quest to establish, defend, and give meaning to their nascent North American empires.
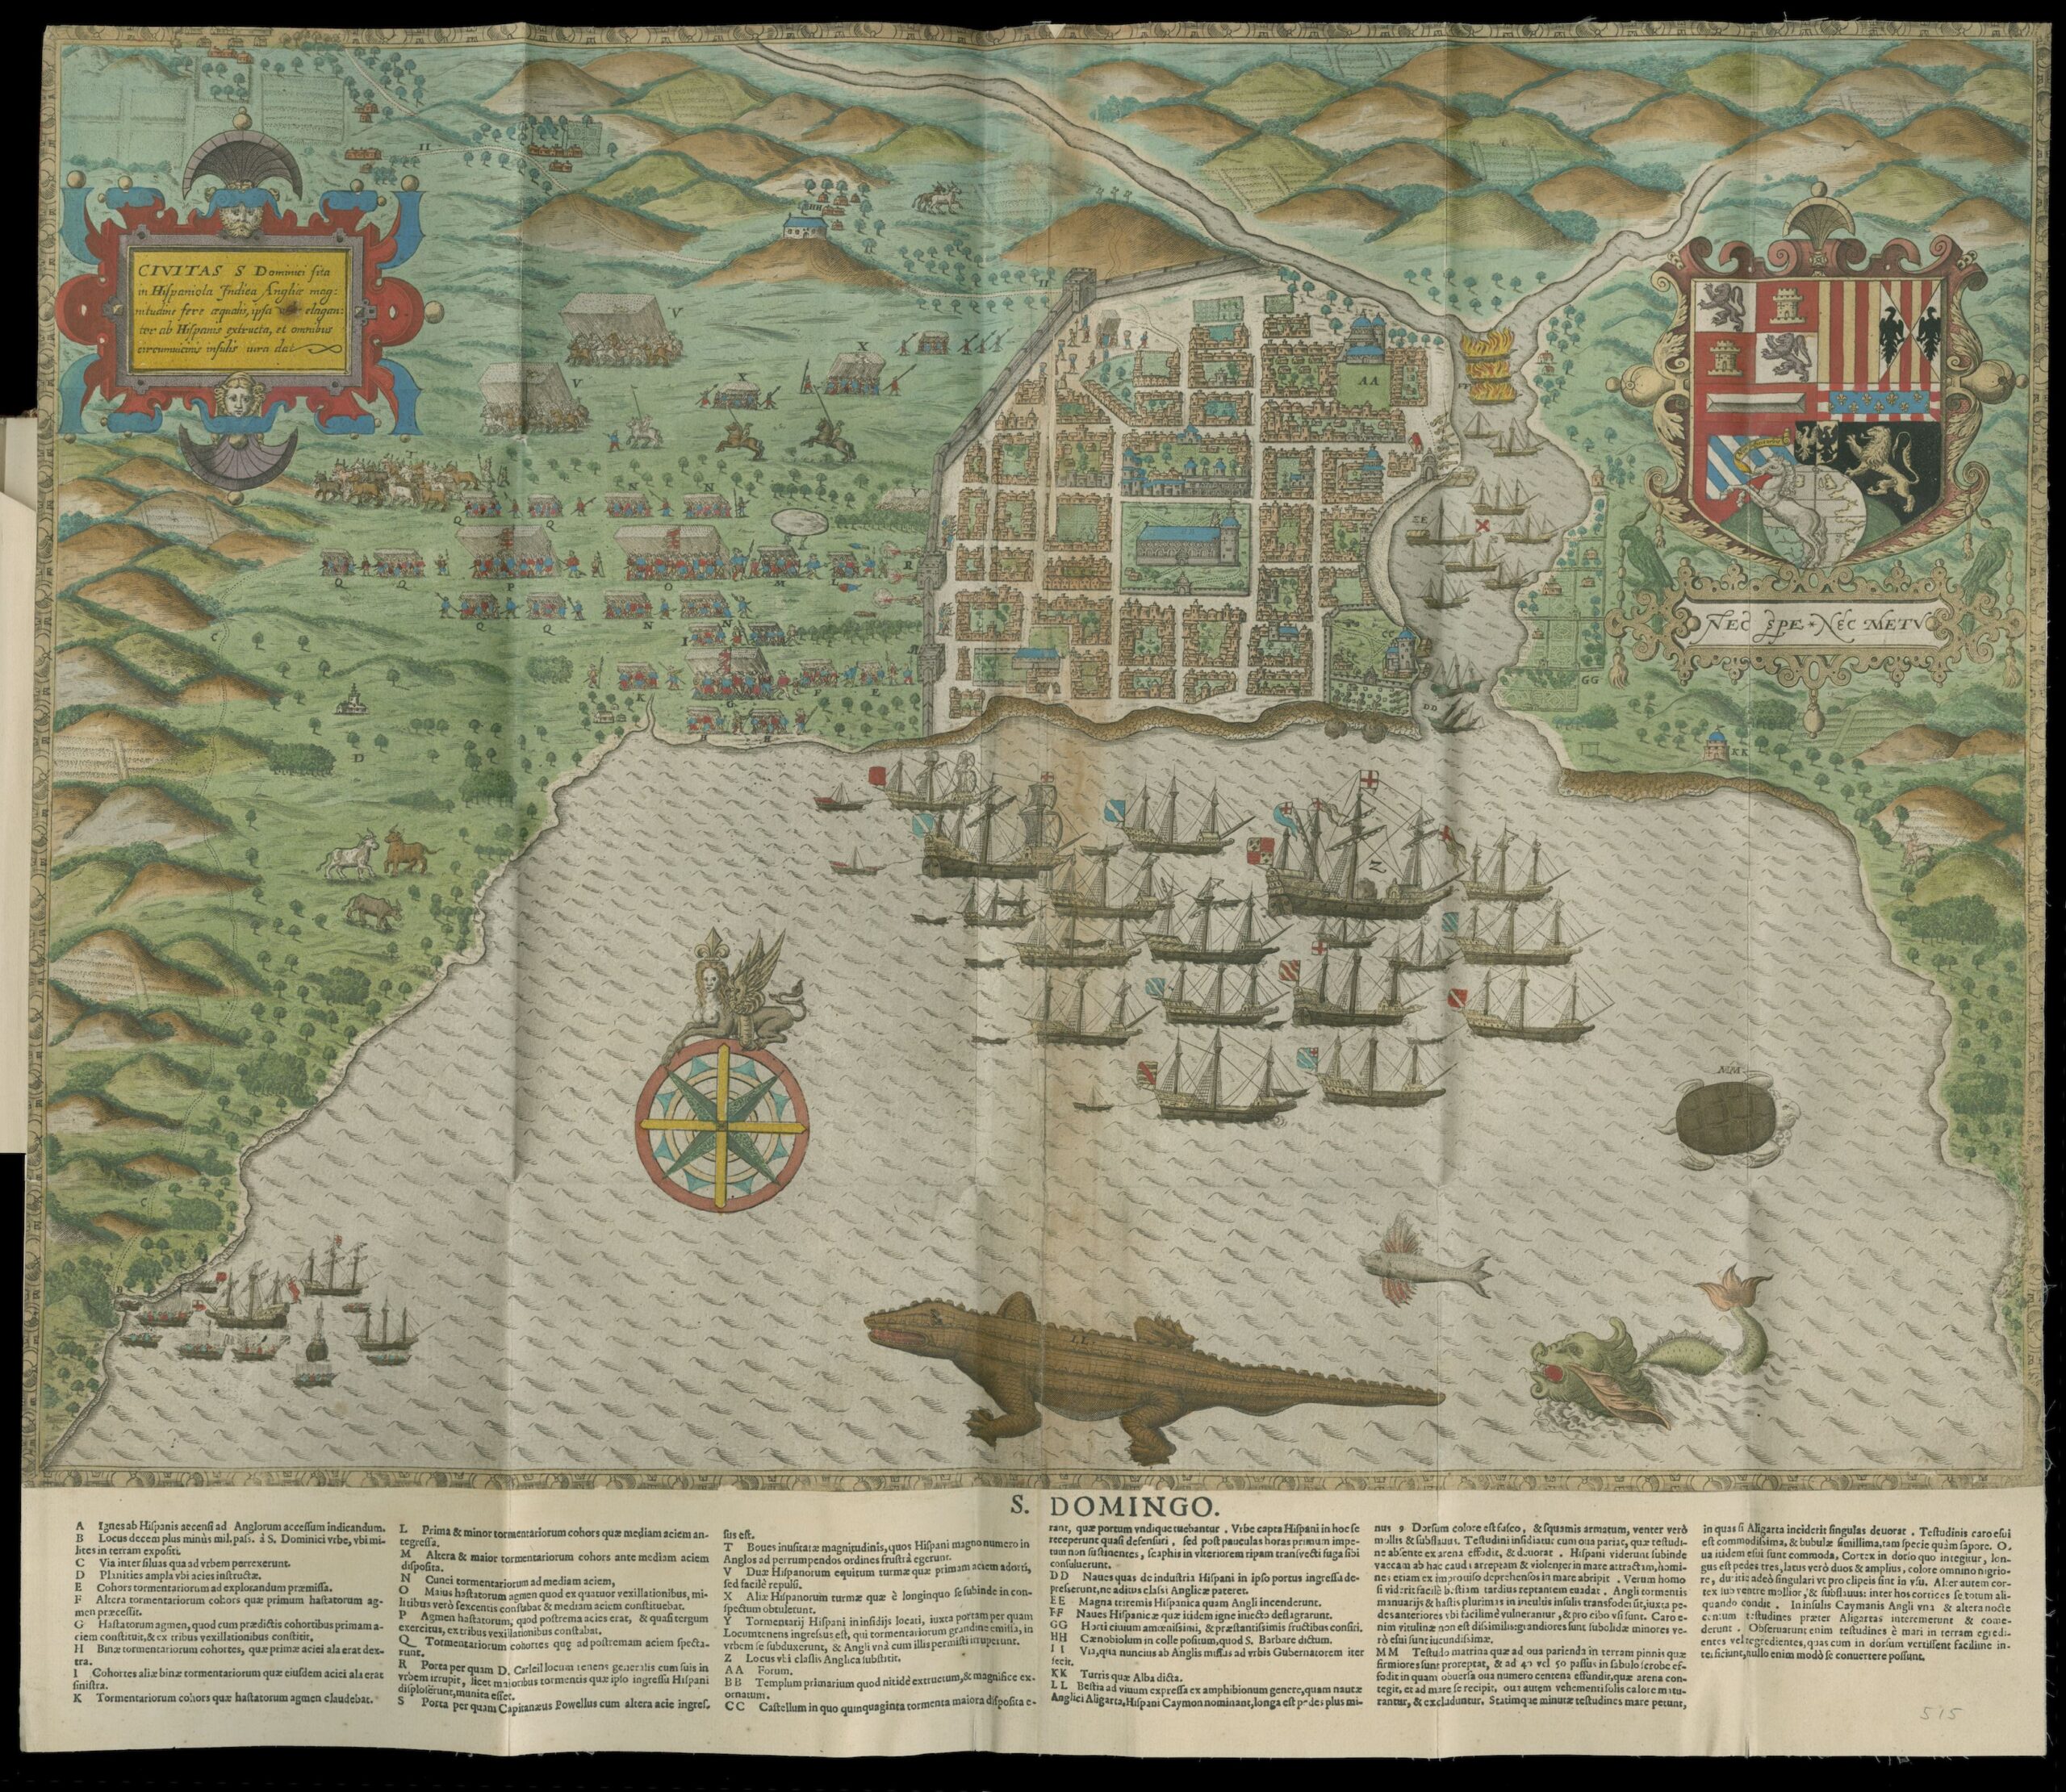
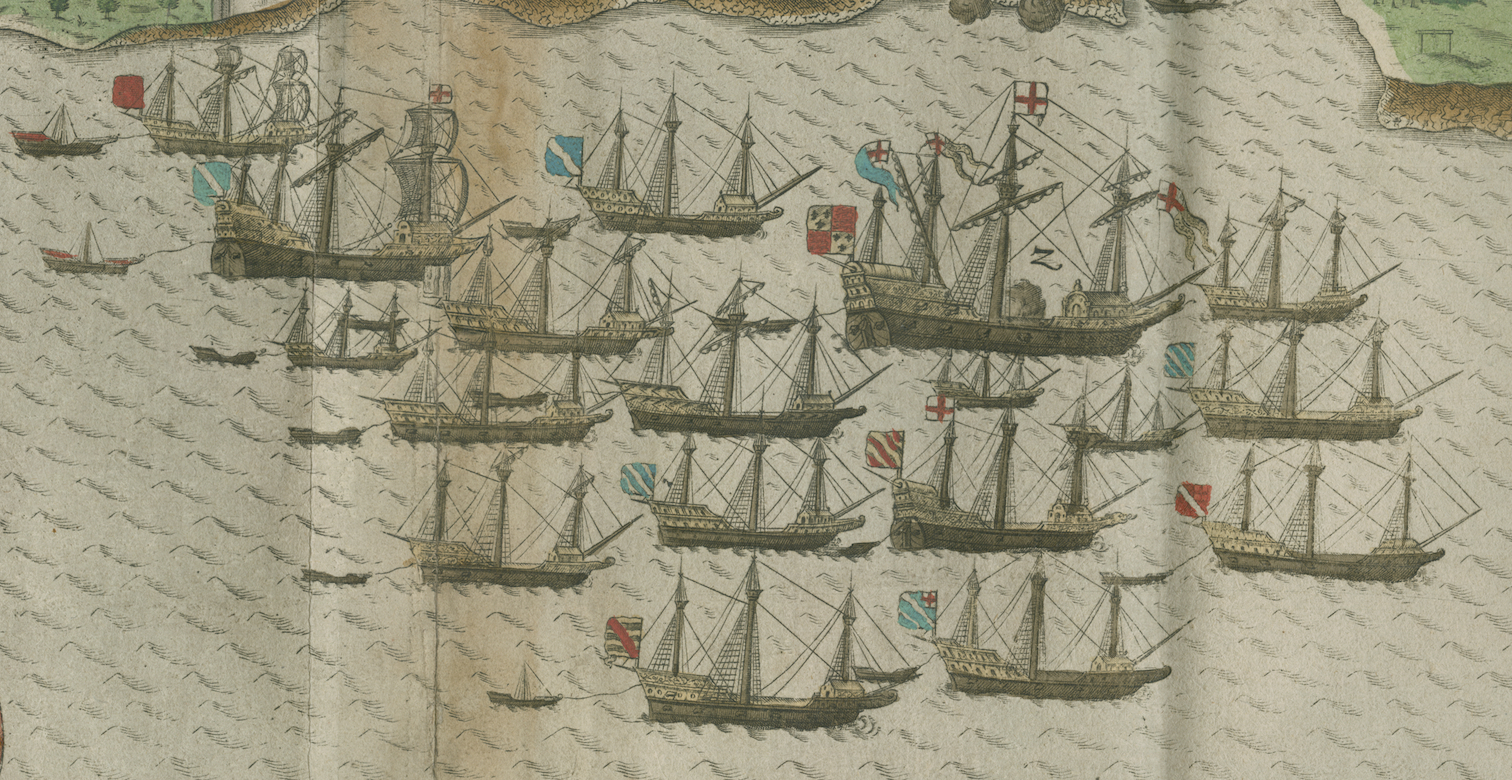
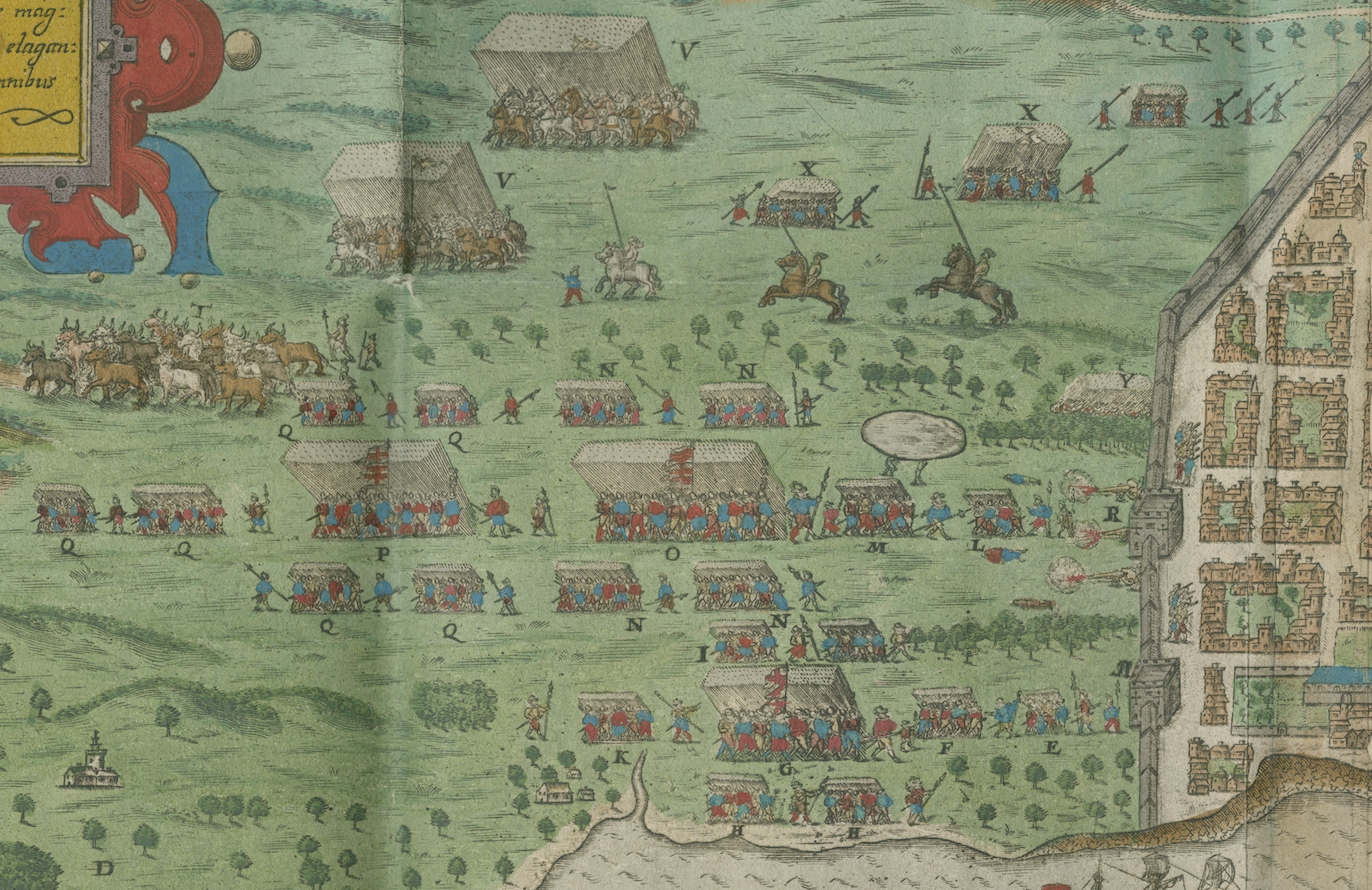
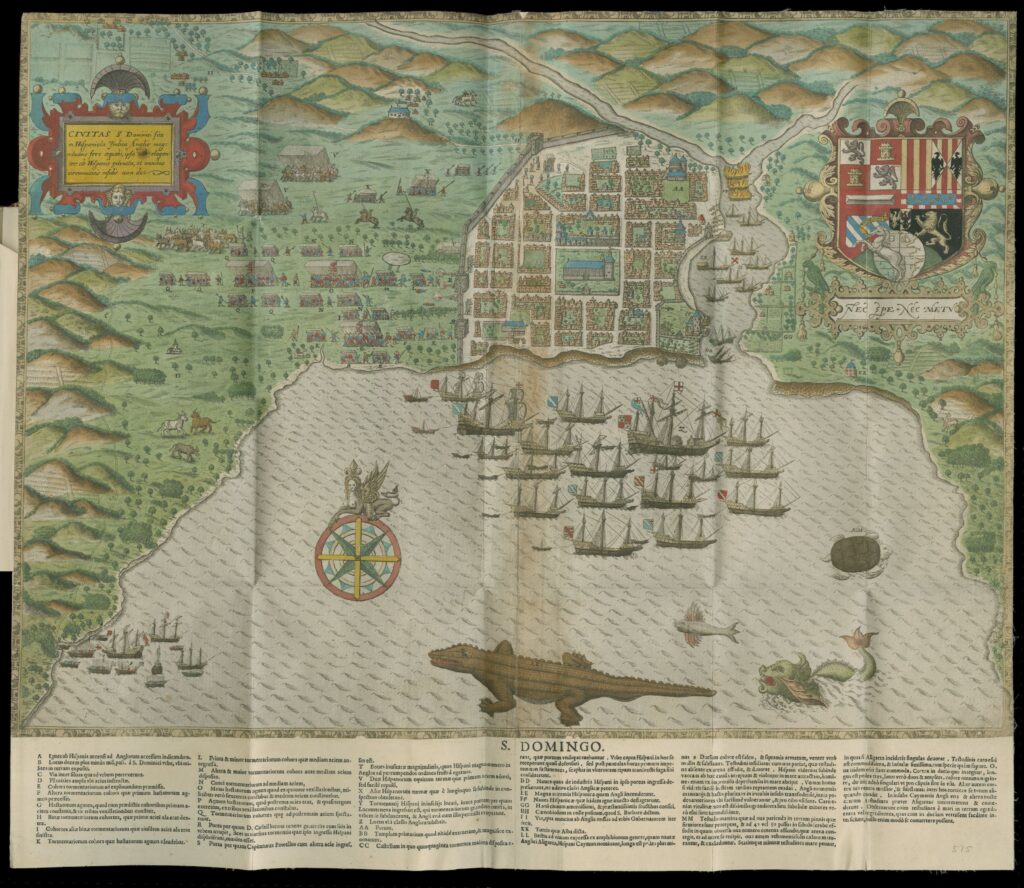
Prior to the seventeenth century, England’s leaders expressed little interest in colonizing North America. Instead of colonists, Queen Elizabeth I sent pirates like Sir Francis Drake to raid Spanish settlements and their annual shipments of American bullion. Baptista Boazio’s map depicts Drake’s 1586 raid on the Spanish colony of Santo Domingo, located on the island of Hispaniola. Santo Domingo, Spain’s first permanent American colony, served as the de facto capital of New Spain for much of the sixteenth century. Although Drake expected the colony to be full of riches, he instead discovered a fledgling settlement easily overwhelmed by his force of about 1,000 men.
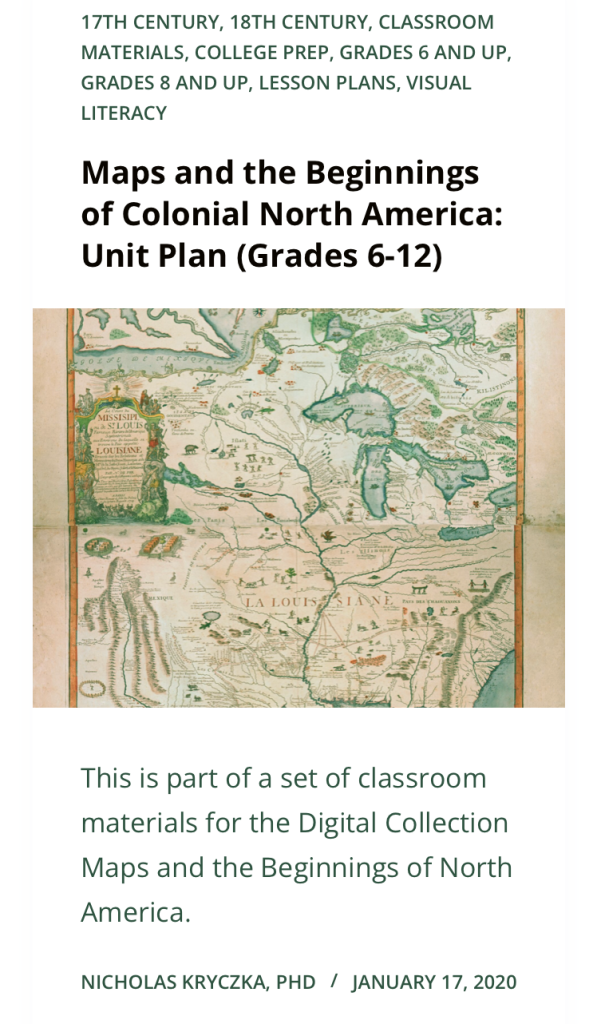
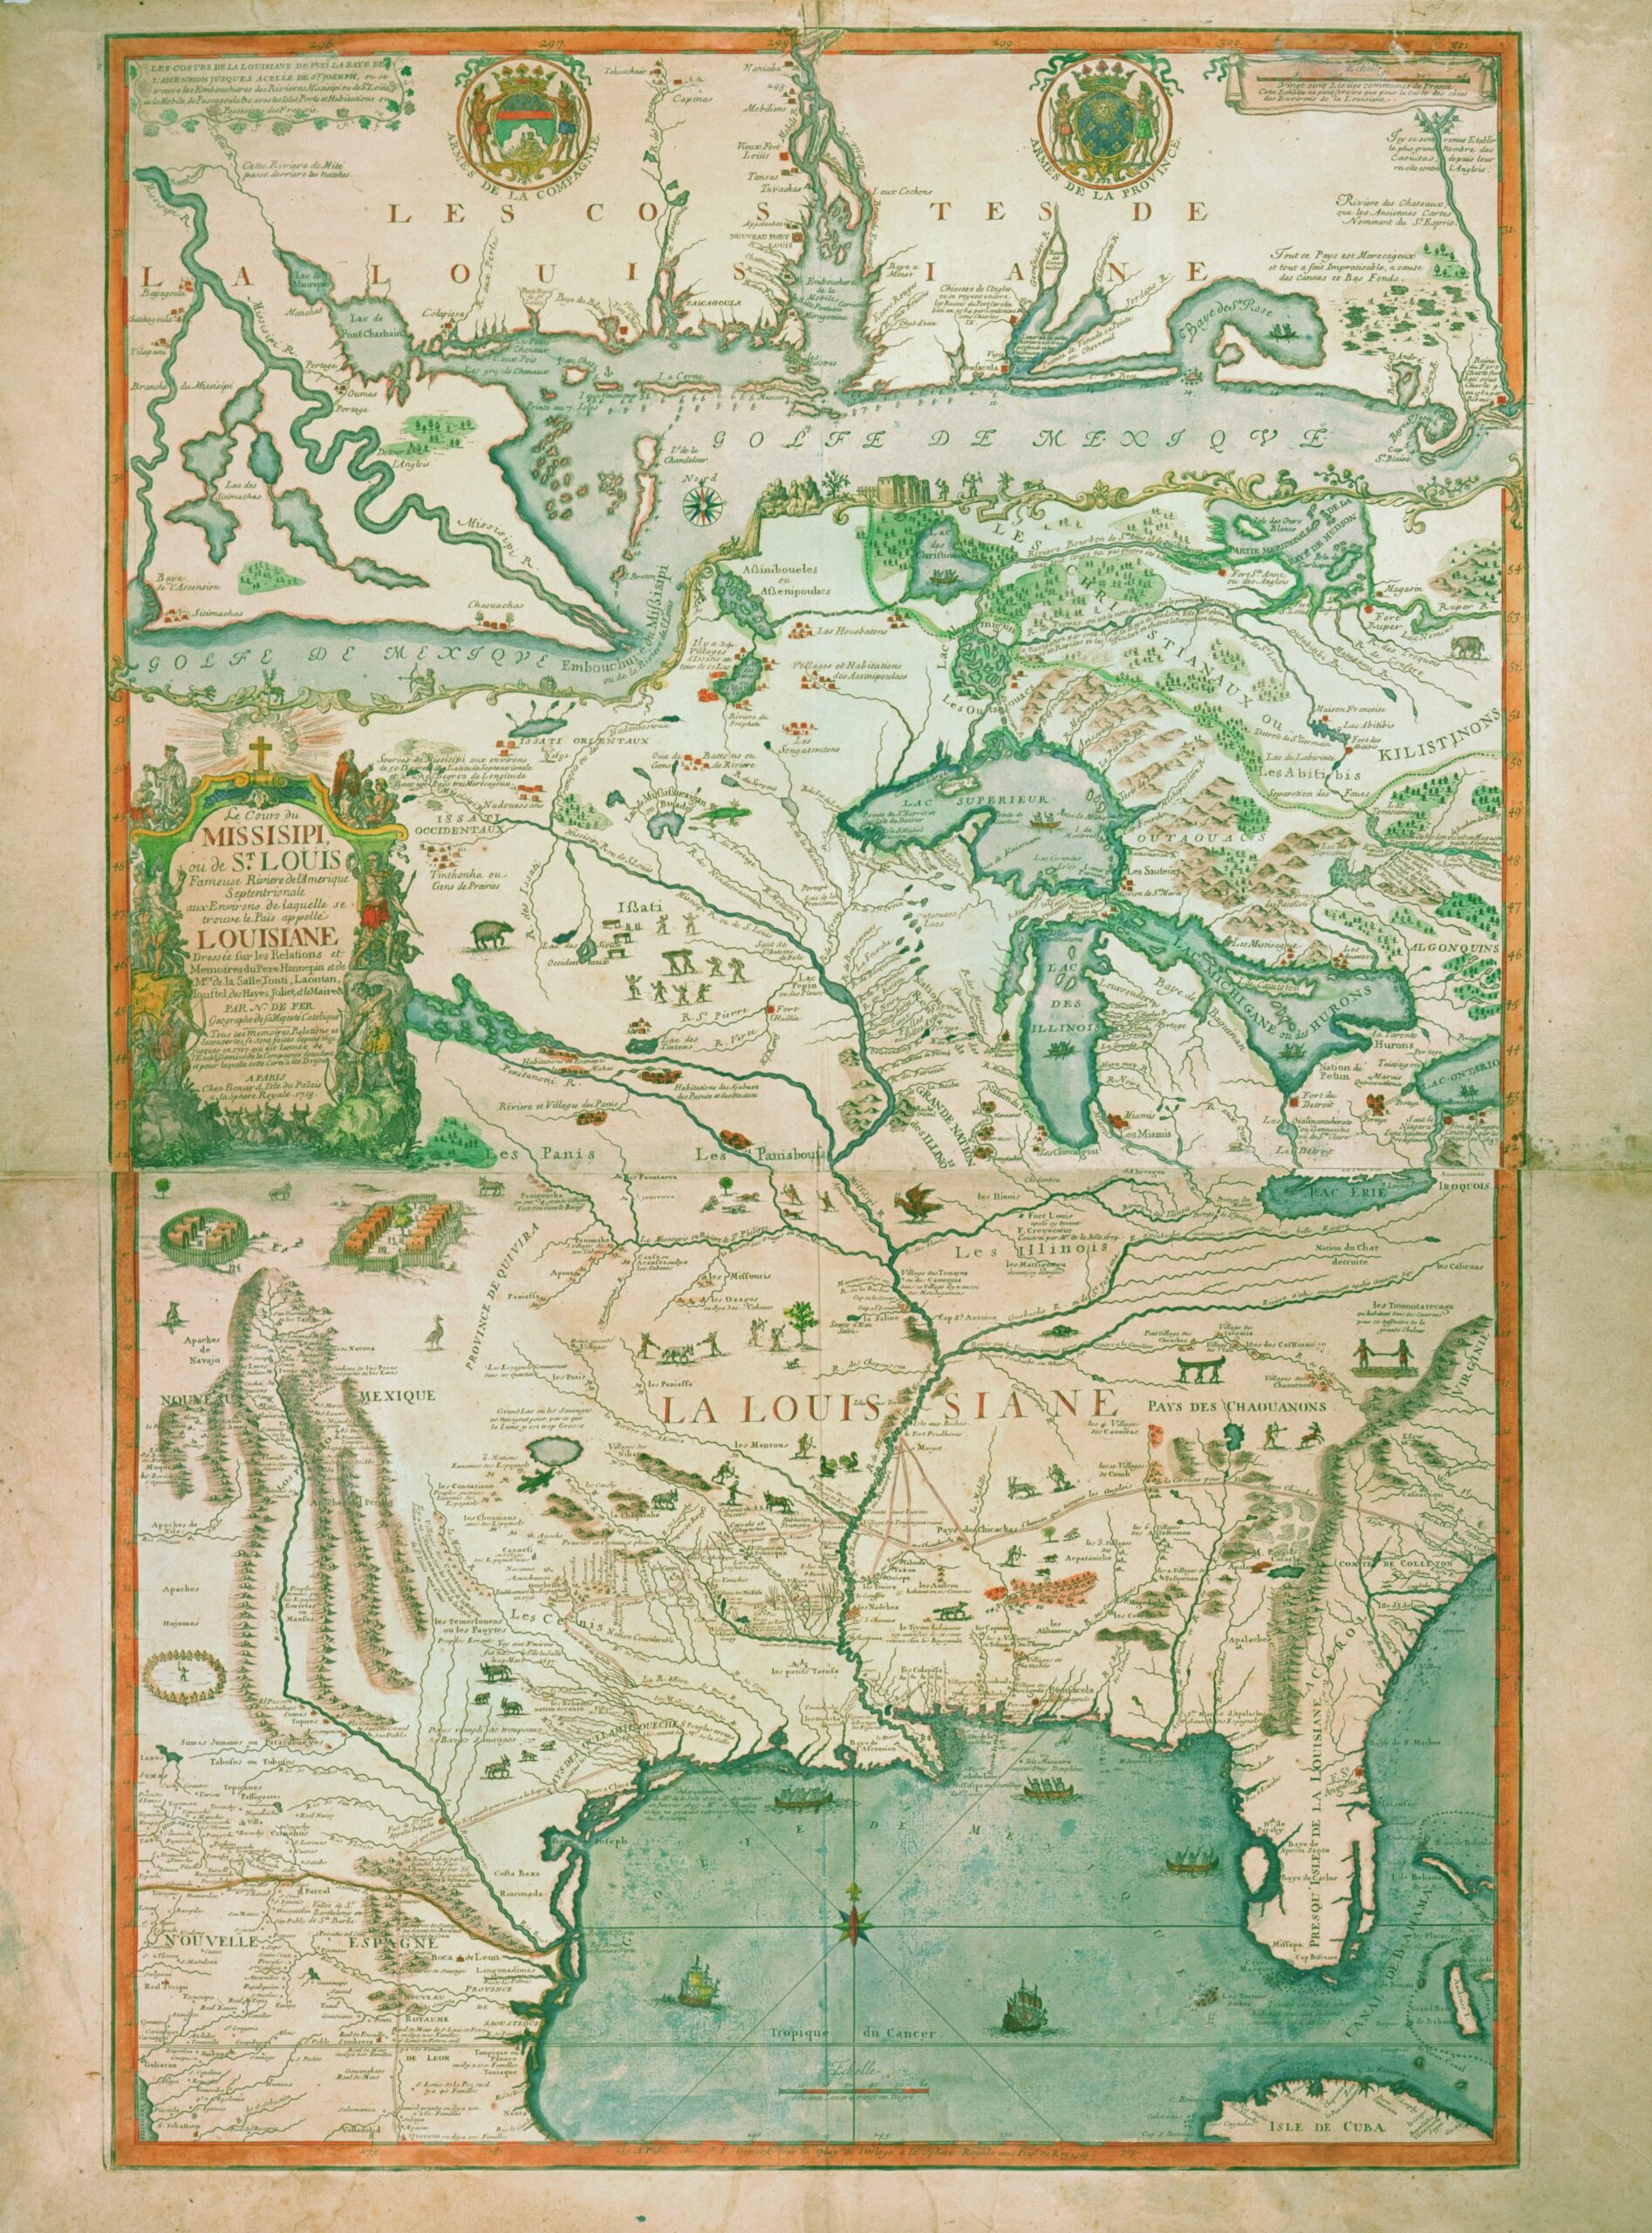
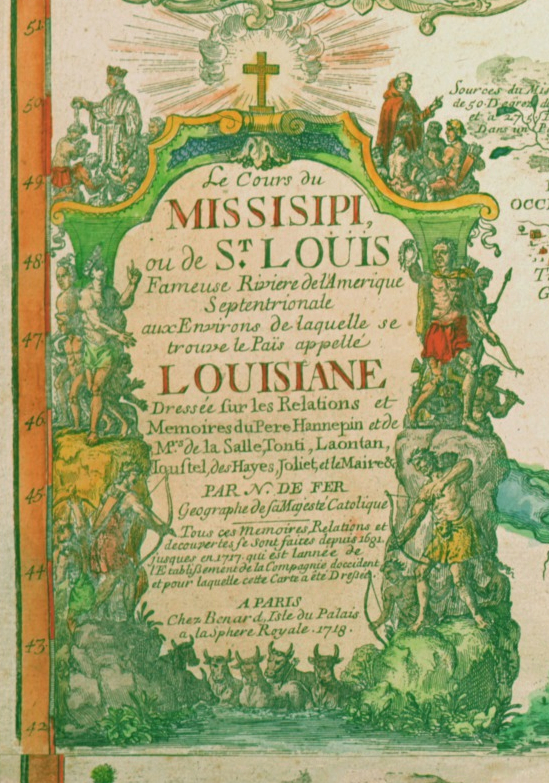
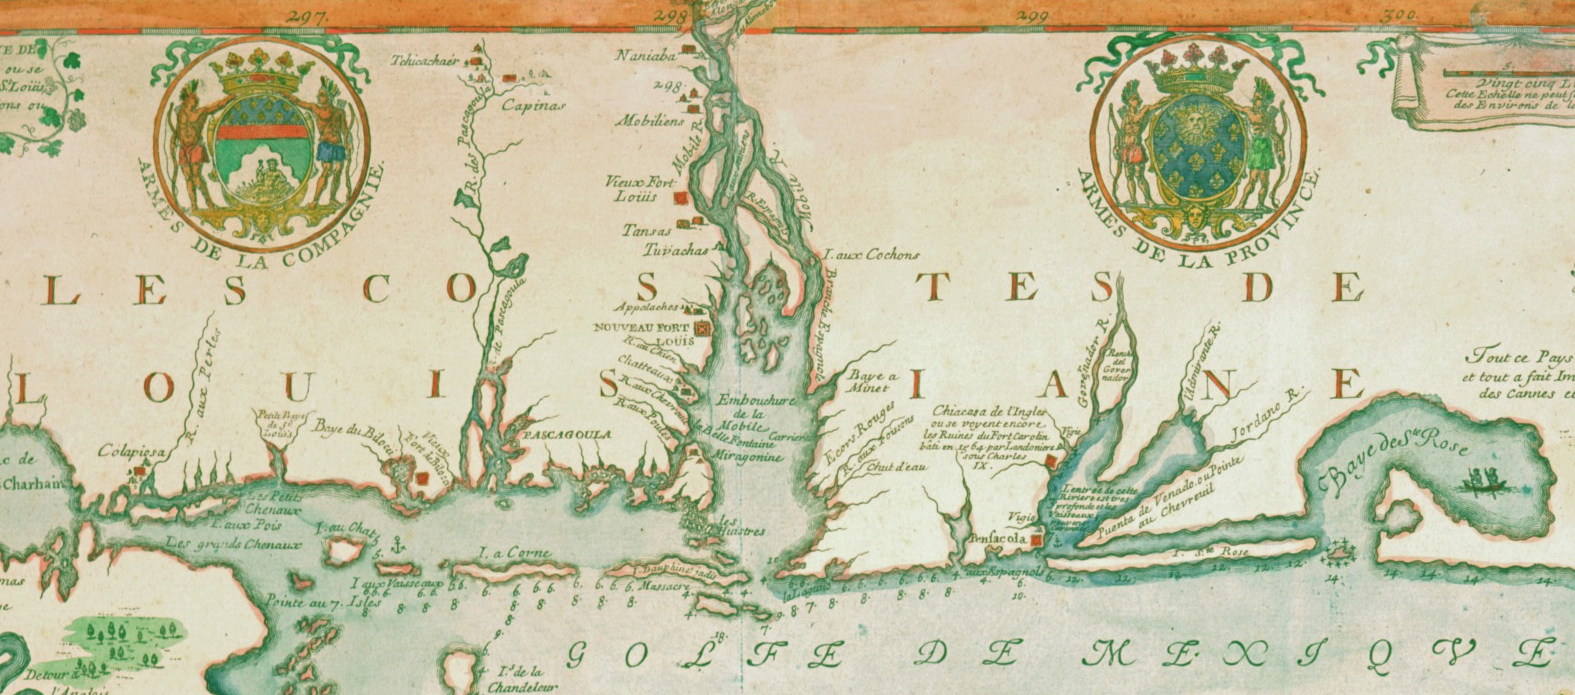
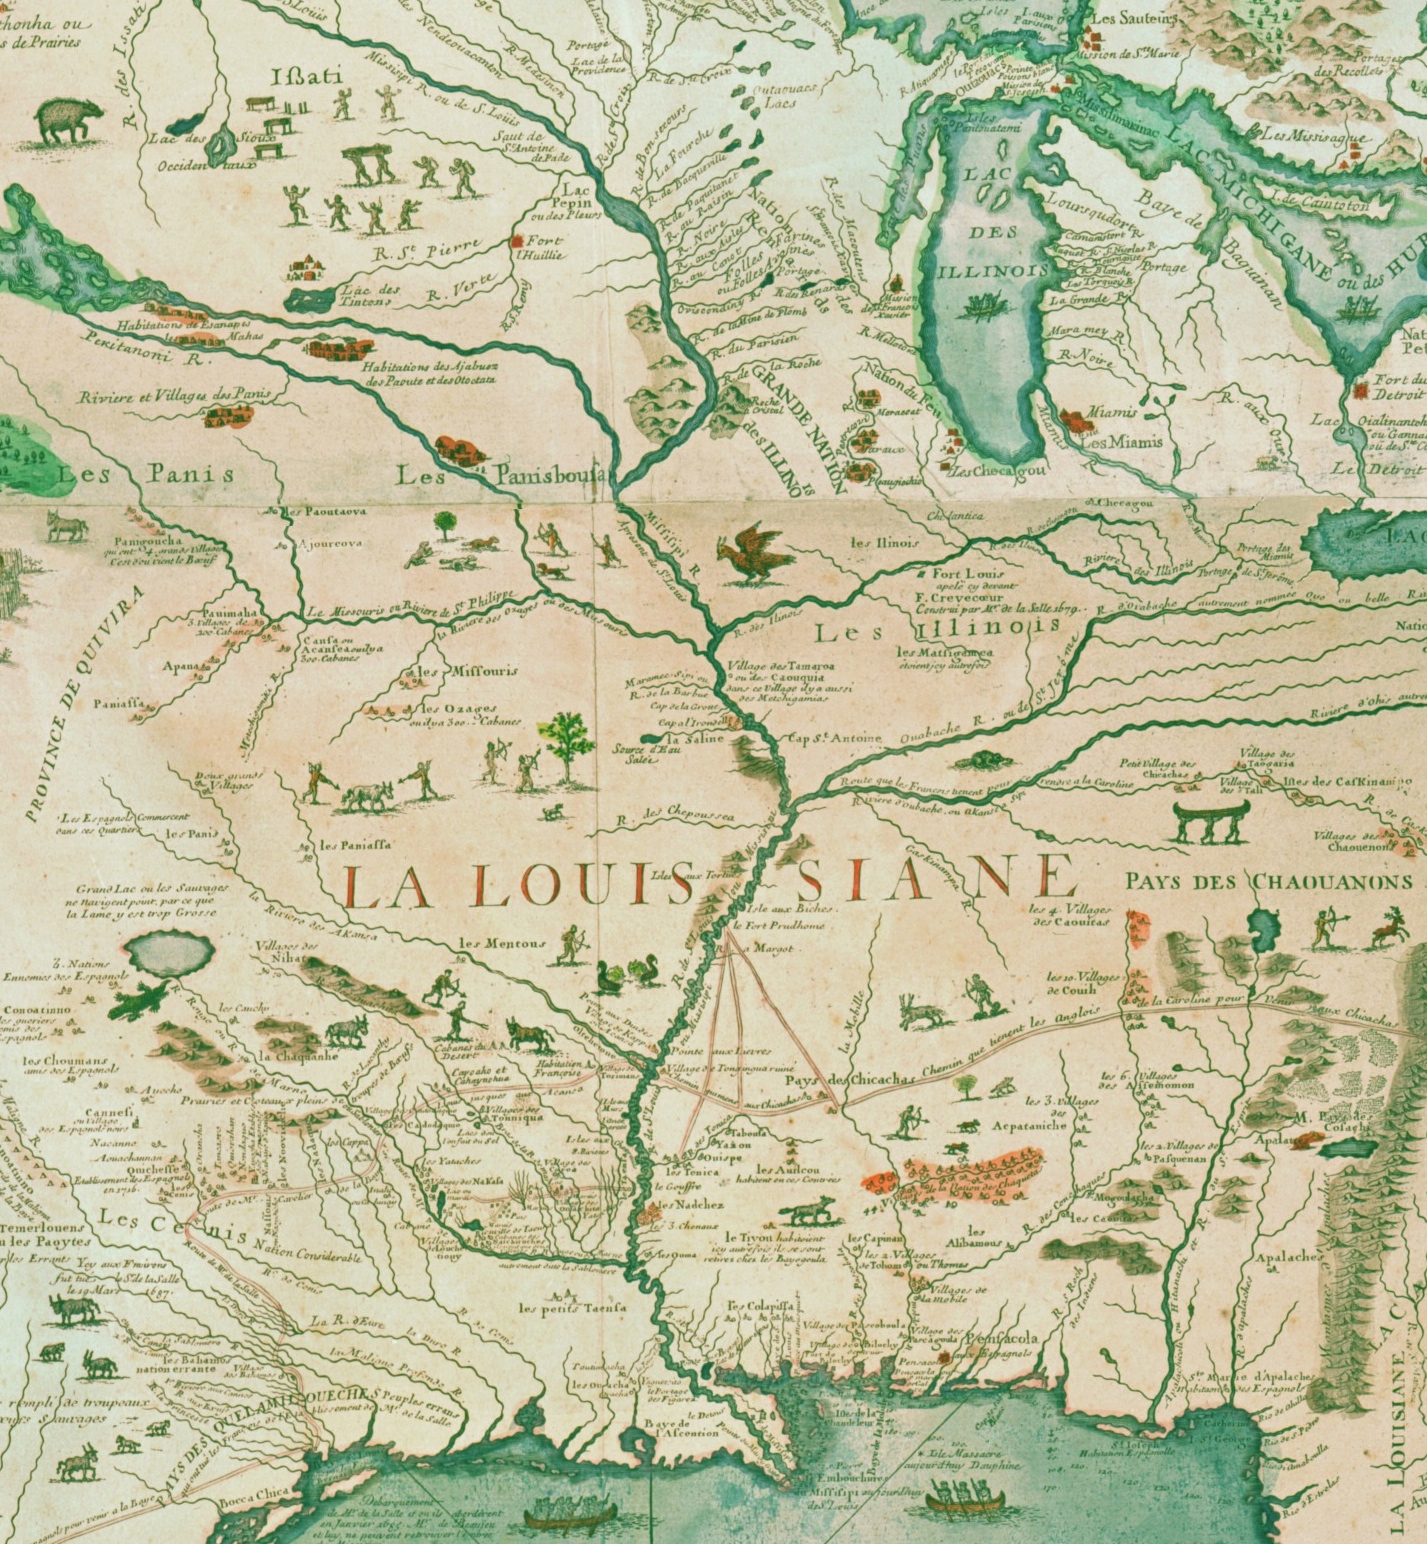
Spain’s New World wealth also stimulated French interest in North America. Founded in 1699, the French colony of Louisiana encompassed the Mississippi River valley, a vast territory stretching from the Gulf of Mexico to the Great Lakes. Louisiana linked French colonies in Canada and the Caribbean and blocked British colonies on the East Coast from expanding westward. As a result, the French considered Louisiana essential to the prosperity and security of their North American empire. To facilitate Louisiana’s development, King Louis XIV of France granted a monopoly on colony trade to the Compagnie d’occident, or Company of the West. As part of its campaign to lure French investors and colonists, the company commissioned Nicolas de Fer to create a map of the territory and its natural resources. The map and other publicity material fueled a period of intense land speculation known as the “Mississippi Bubble,” which burst and nearly ruined the colony in 1720.
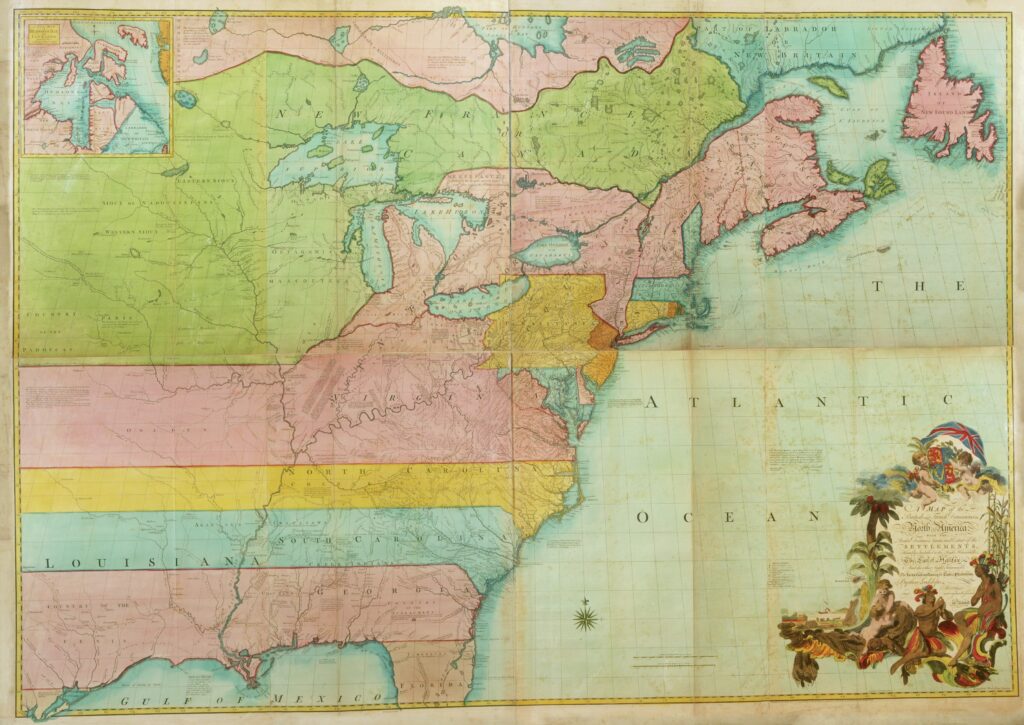
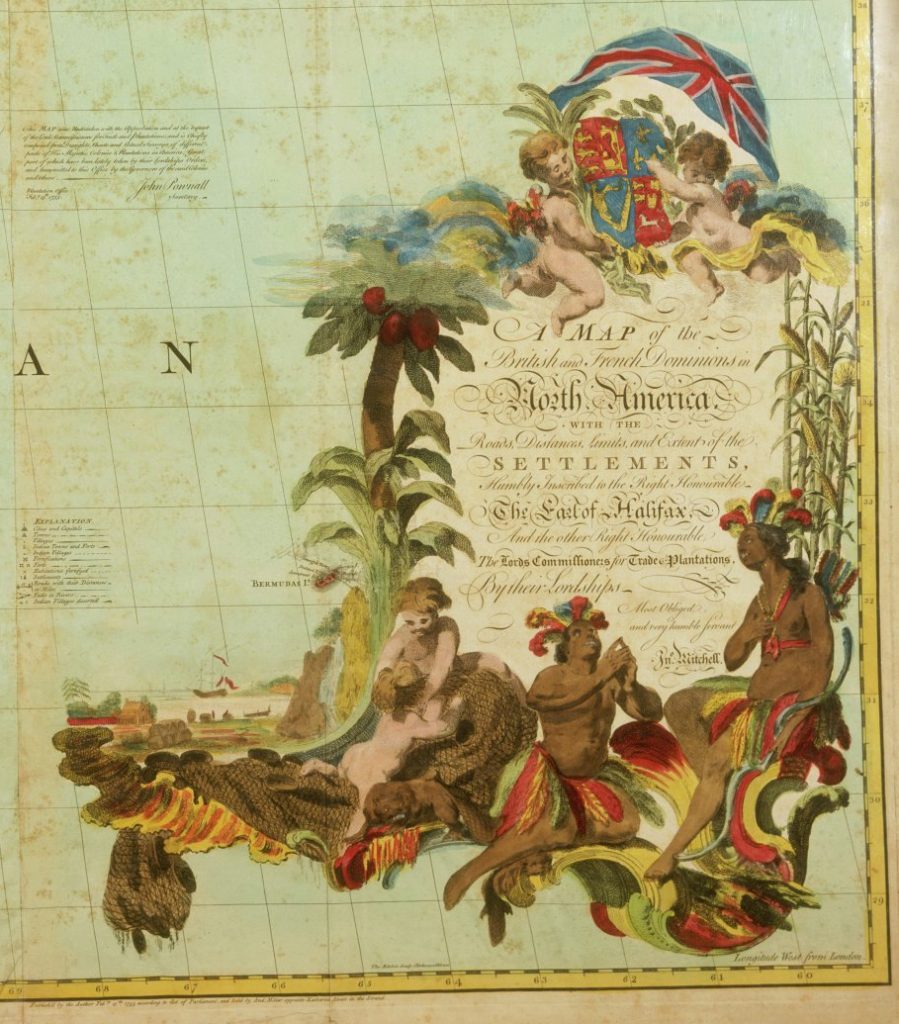
Interest in the Louisiana territory did not die with the Mississippi Bubble. By the mid-eighteenth century, both France and Britain contended for control of the land, a contest that soon led to the Seven Years’ War (1754–1763). It was in the context of this imperial rivalry that the British Board of Trade and Plantations, which oversaw Britain’s American empire, commissioned John Mitchell’s map of British and French dominions in North America. The map reflects Mitchell’s extensive research of colony charters, existing maps, and reports from colonial officials. Measuring over four feet tall and six feet wide, the map represented North America in extraordinary detail and buttressed British claims to land west of the Appalachian Mountains. Mitchell’s map supplied British officials with a definitive map of their colonies, and later helped American patriots set the boundaries of the new United States.
Questions to Consider
Related Classroom Materials:
Baptista Boazio’s 1588 “Civitas S. Dominici sita in Hispaniola” and Nicolas de Fer’s 1718 “Le cours du Missisipi” are featured in the classroom activity Visual Literacy Class Activity for Grades 3-5.
All the maps in this section appear in the Document-Based Questions for this collection and the Unit Plan Grades 6-12.
Colonial North America appears different depending on the scale at which one sees it. Even as colonists carved North America into empires, their most immediate concerns often revolved more around the local, day-to-day challenges of life on the ground—the places where visions and realities intersected. Instead of vast imperial domains, the documents below illustrate how specific individuals conceived of local worlds and imagined what colonial America was, was not, or might become.
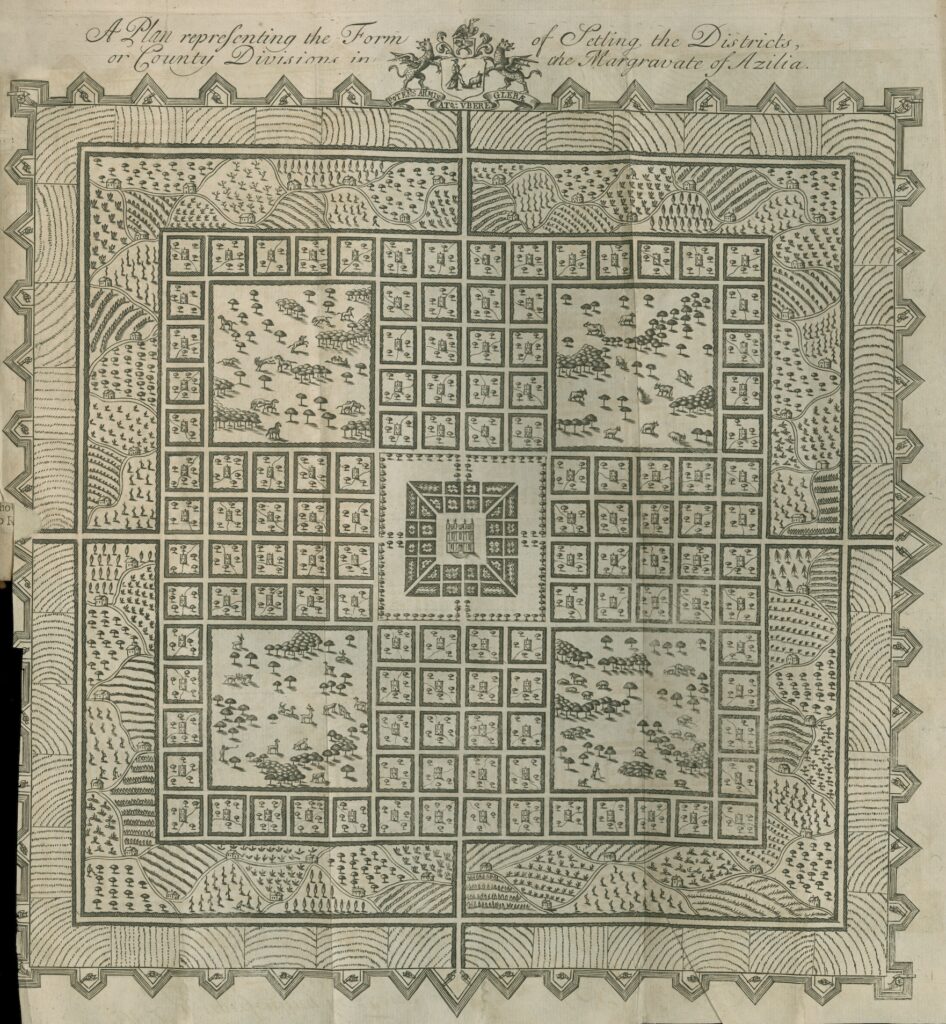
According to Sir Robert Montgomery, a Scottish land speculator who had never been to America, the territory between South Carolina and Florida was nothing less than the “Most Delightful Country of the Universe.” Montgomery designed the Margravate (or colony) of Azilia to match the supposed splendor of its environment. As he imagined it, Azilia would consist of four districts that surrounded the governor’s “palace.” An 80 mile-long defensive perimeter would secure the colony against an attack by Spanish, French, or American Indian enemies. Although a number of British investors bought into Montgomery’s vision, he never secured enough funding to bring the dream of Azilia to fruition.
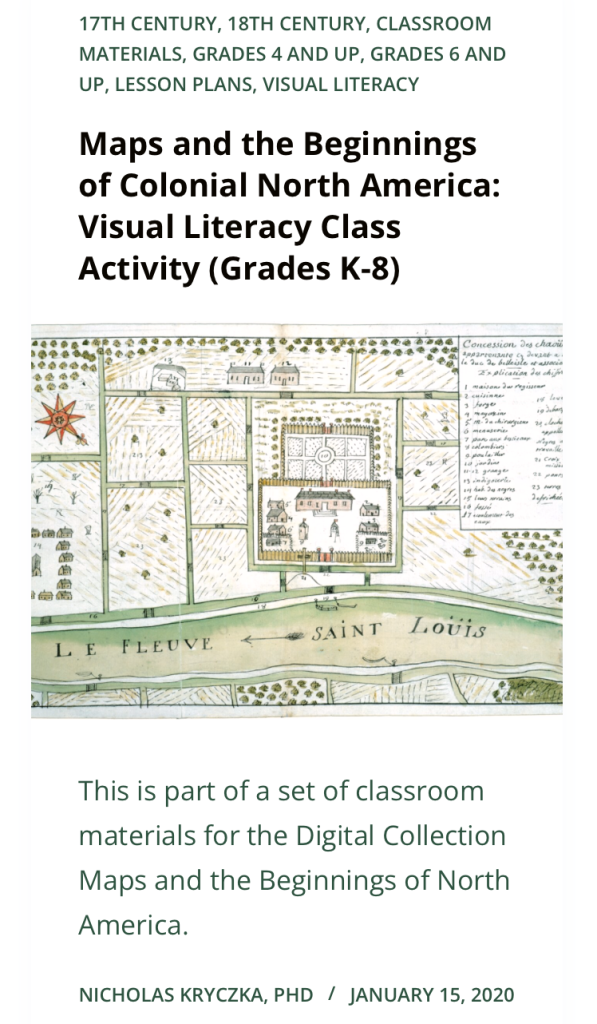
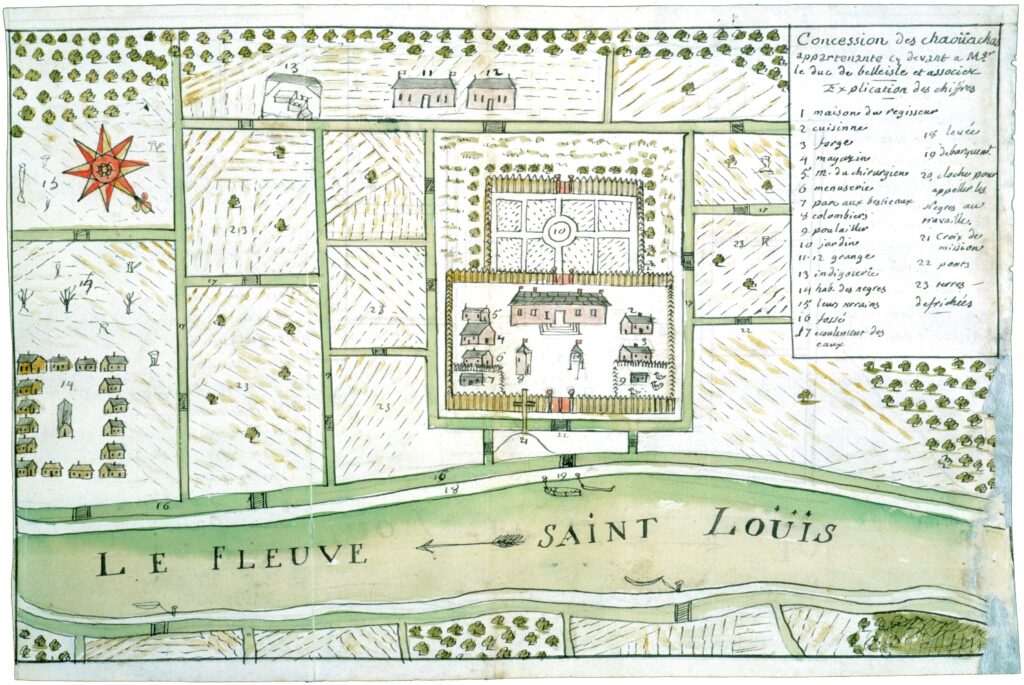
In his 1747 memoir, the French colonial officer Jean-François-Benjamin Dumont de Montigny described the Chaouachas Concession as the “finest of all the concessions” in the French colony of Louisiana. Situated on the lower Mississippi River, then known as the St. Louis River, the concession (or land grant) took its name from the Chaouachas Indian village once located there. During the early 1700s, French investors converted the land into what Dumont considered a flourishing plantation “with more than 120 negro men and women, a fine manor house and outbuildings, a storehouse, forge, workshop, indigo works, wharf, a fine courtyard, livestock, cabins for the laborers and the negroes, and a manager to look after it all.”
Questions to Consider
Related Classroom Materials:
Sir Robert Montgomery’s 1717 “A Plan Representing the Form of Setling the Districts” appears in the Document Based Questions for this collection.
All the maps in this section appear in the Unit Plan Grades 6-12.
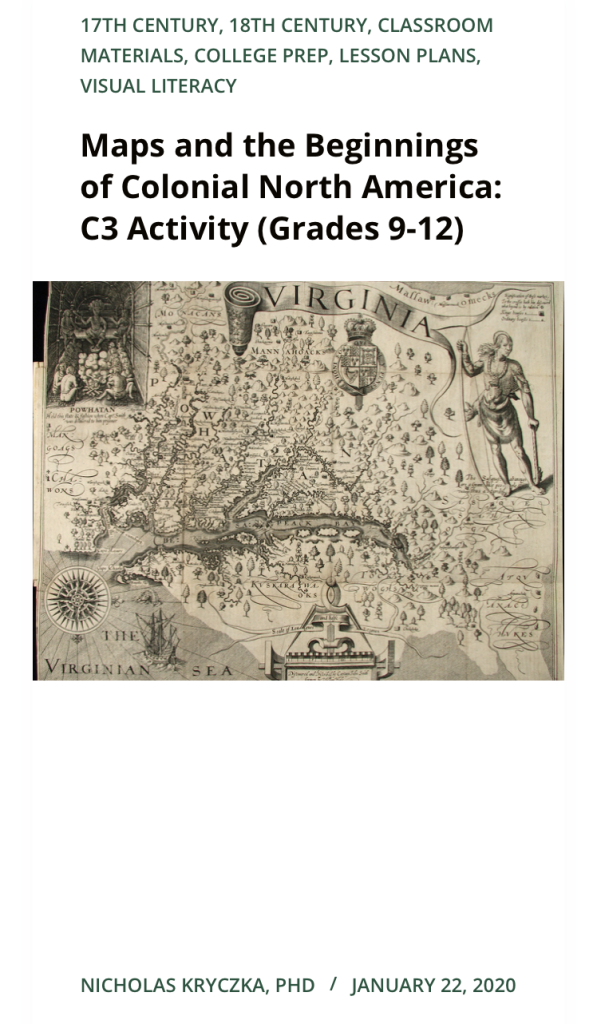
Establishing viable colonies in North America required more than forts and colonists. European colonists had to take the Indigenous world they discovered and make it into their own. As the struggle to found the Virginia colony showed English colonists, that transformation occurred piecemeal. Particularly in a colony’s first years, the boundaries between Indigenous and English worlds could be difficult to discern.
The documents in this section offer both English and Indigenous views of seventeenth-century Virginia. When considered together, the maps suggest how English colonists and promoters took possession of an area Powhatan Indians called Tsenacomoco and remade it into an English colony named Virginia. Instead of portraying an outright English conquest, the maps remind us of how English colonists initially depended on aid from American Indians.
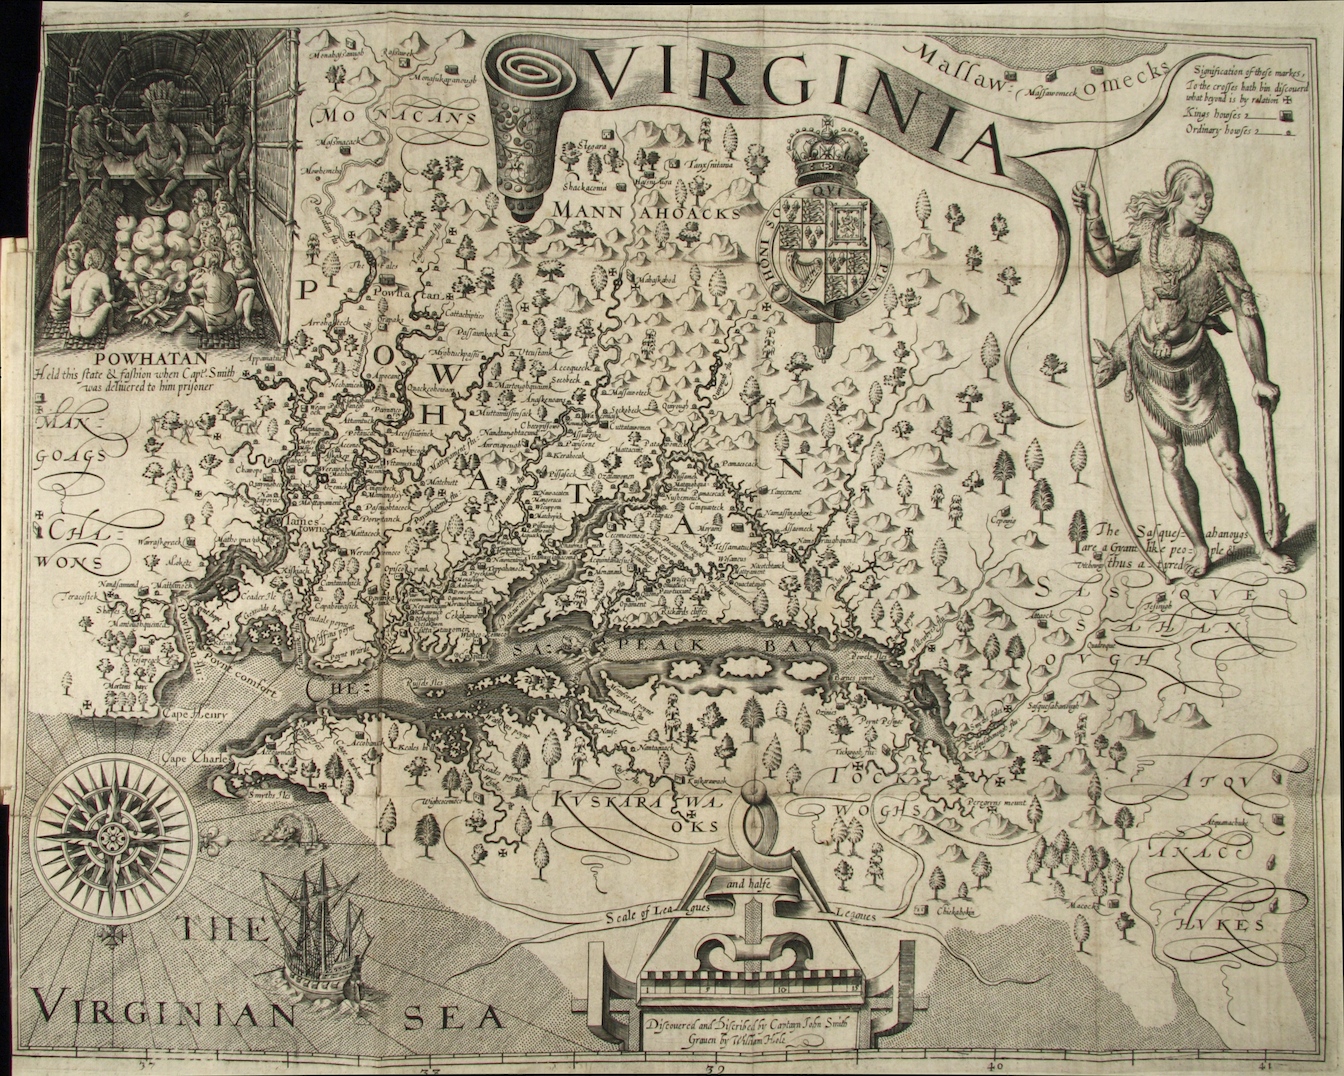

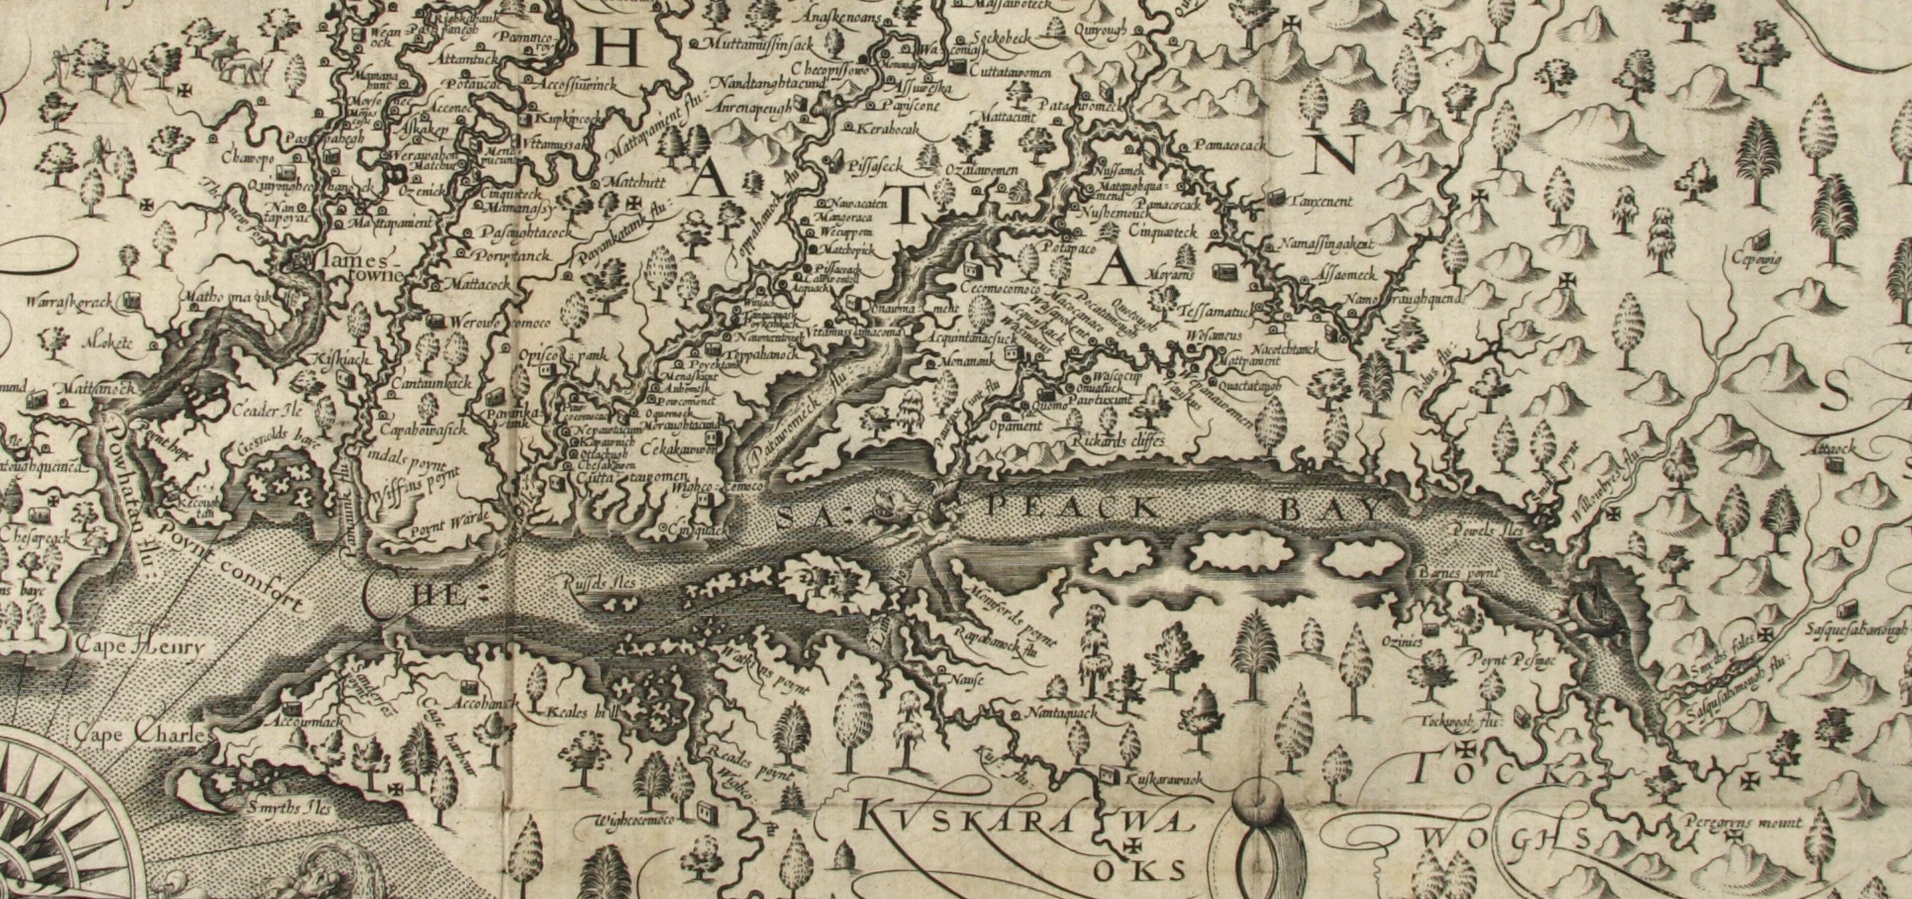
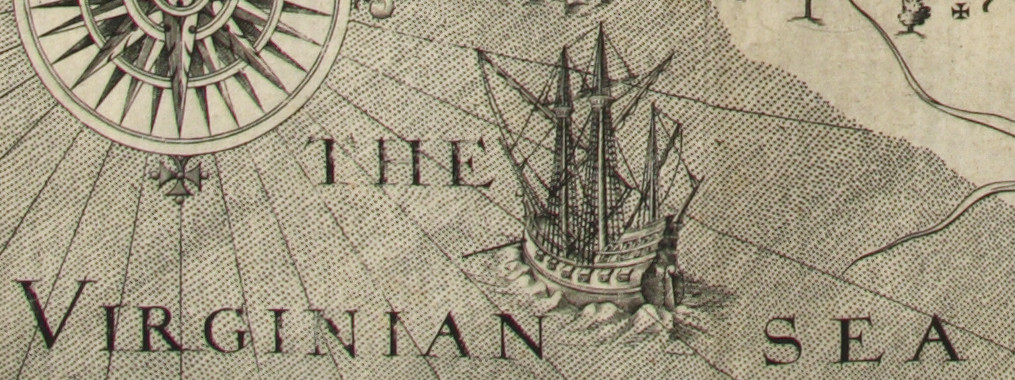
The English explorer and colonist Captain John Smith played a leading role in English efforts to establish the colony of Virginia, beginning with the Jamestown settlement in 1607. Smith’s 1612 map of Virginia integrates knowledge acquired during his own explorations between 1607 and 1609 with information provided by the region’s Indigenous population. A series of crosses distinguish the area Smith knew through first-hand experience from the surrounding territory, whose geography he could only conjecture from second-hand Indian “relations.” At the time of its publication, this map’s geographic detail surpassed that of all existing maps of the region. In addition to charting land and waterways, Smith identified the English names of 32 places and the Algonkian names of over 160 villages, 24 “King’s houses,” 16 rivers, and 10 tribes.
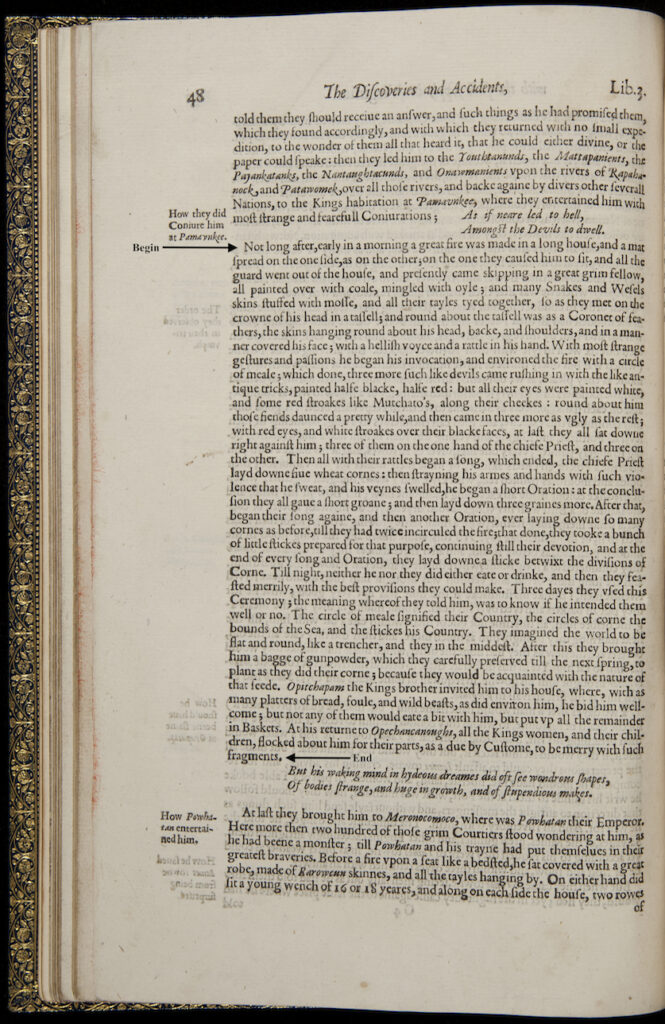
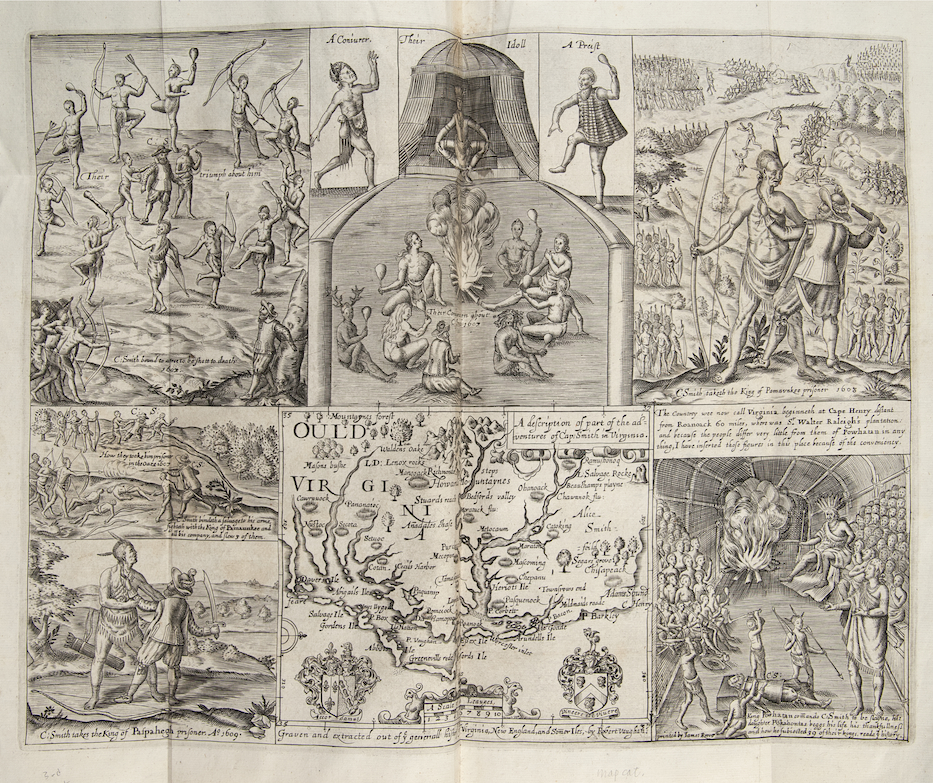
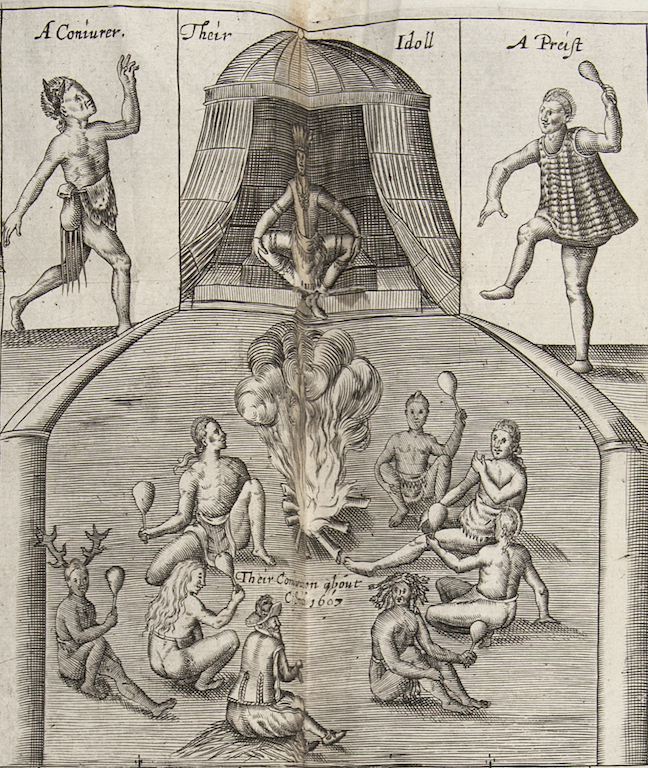
In a later chronicle of his time in Virginia, John Smith recalled how Powhatan Indians mapped their world for him during an elaborate ceremony in 1607. Over the course of three days, Smith watched as the Indians laid out concentric circles of meal, corn, and sticks. The circles represented the Powhatan territory and Atlantic Ocean, as well as Smith’s own “Country.” This type of ceremony was typical of American Indian cartography, which tended to be emphemeral (or short-lived), with maps communicated orally or made in impermanent forms, such as drawings in the sand.
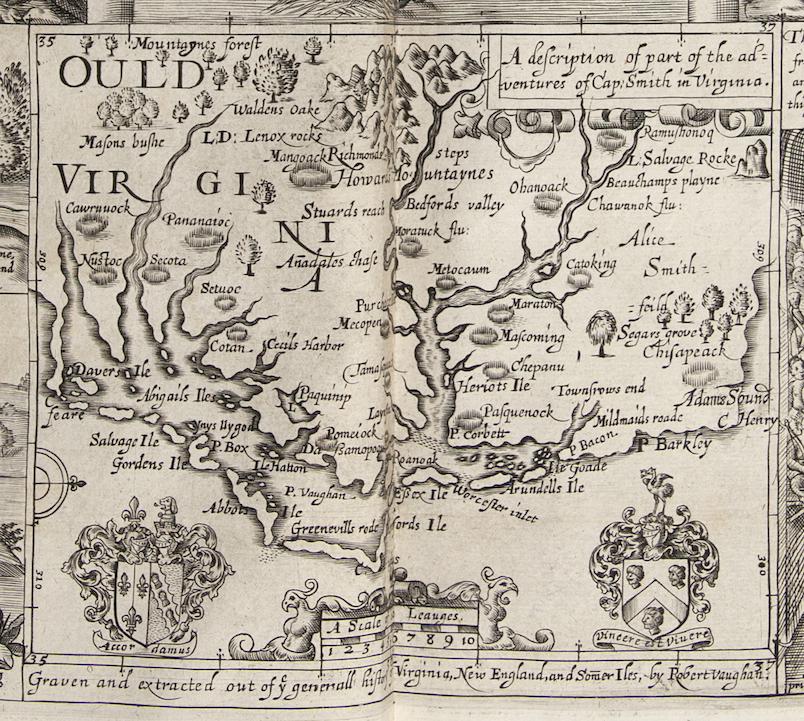
The English artist Robert Vaughan imagined what one part of the mapping ceremony (what he calls “Their Conjuration”) may have looked like in an engraving that accompanied John Smith’s Generall Historie. Below the illustration, Vaughan also provided an alternative map of Virginia. The map’s title—“Ould Virginia”—implies that it depicts Virginia as it formerly looked. Unlike in John Smith’s earlier map, which identified the majority of places by their Algonkian name, Vaughan uses mostly English place names.
Questions to Consider
Related Classroom Materials:
The documents in this section appear in the Document-Based Questions for this Collection.
The maps in this section appear in the Unit Plan Grades 6-12.
After his time in Virginia, Captain John Smith shifted his attention to the American northeast—a region he named “New England” in 1614. Smith never identified New England’s precise limits. Instead, rival English, Dutch, French, and Indigenous claimants formed the region in a series of conflicts that lasted well into the eighteenth century. The following documents record the haphazard ways the region’s inhabitants defined and redefined “New England.”
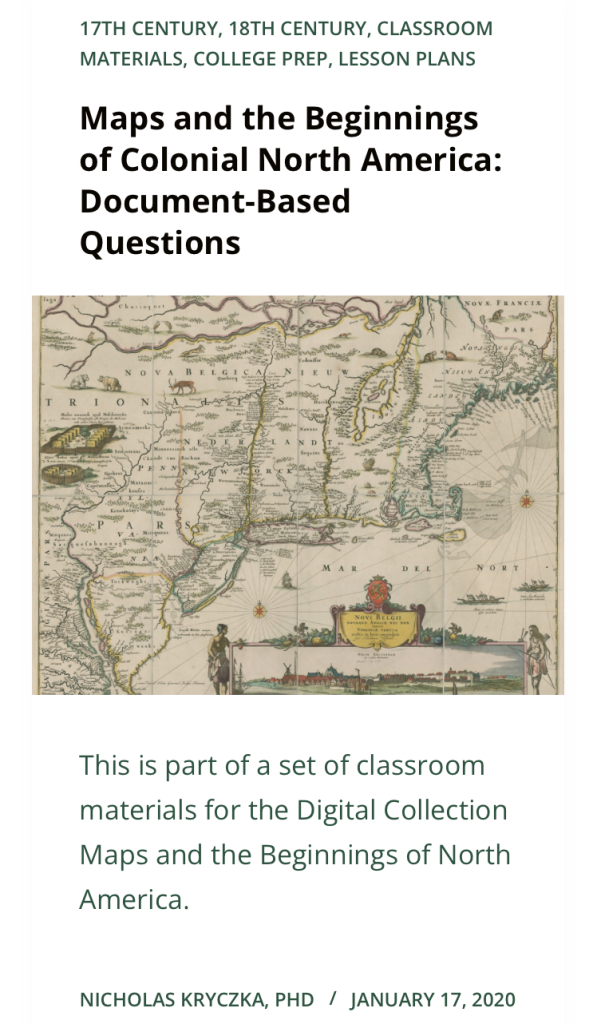
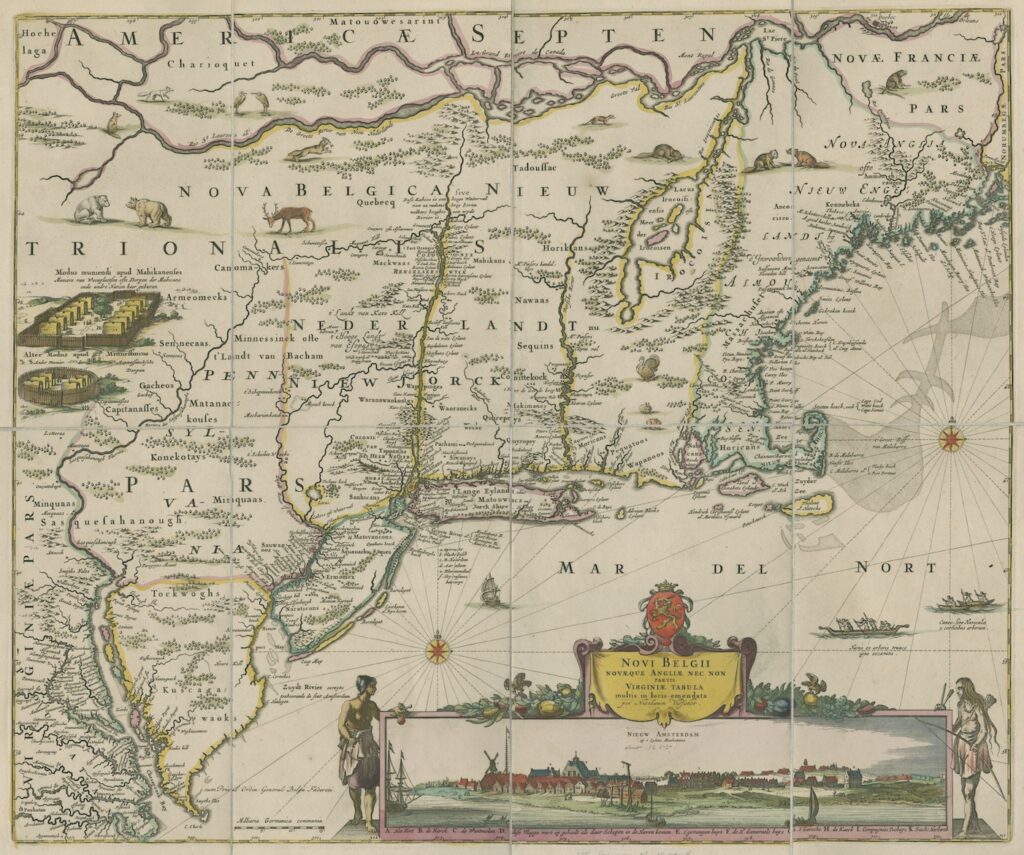
In his seventeenth-century map of New Amsterdam and New England, the Dutch cartographer Nicolaes Visscher reminds us that New England Puritans did not live in isolation. Throughout the seventeenth century, Dutch colonists in the neighboring colony of New Amsterdam contended with English colonists in Connecticut and Massachusetts for control over the land west of Narragansett Bay. The coloring used to delineate political boundaries on this map place the entire English colony of Connecticut within Dutch jurisdiction.
American Indians also contested English claims to New England throughout the seventeenth century. Those tensions erupted into King Philip’s War in 1675. John Foster inscribed the war’s key battles in his map of New England, which was published in 1677 as part of William Hubbard’s A Narrative of the Troubles with the Indians in New-England, from the First Planting Thereof in the Year 1607 to This Present Year 1677. Hubbard’s history of King Philip’s War emphasized stark moral and racial differences between English colonists and American Indians. Although crude in its rendering of New England geography, the map constituted an important milestone in the development of English America—it was the first map drawn, engraved, and printed in the colonies.
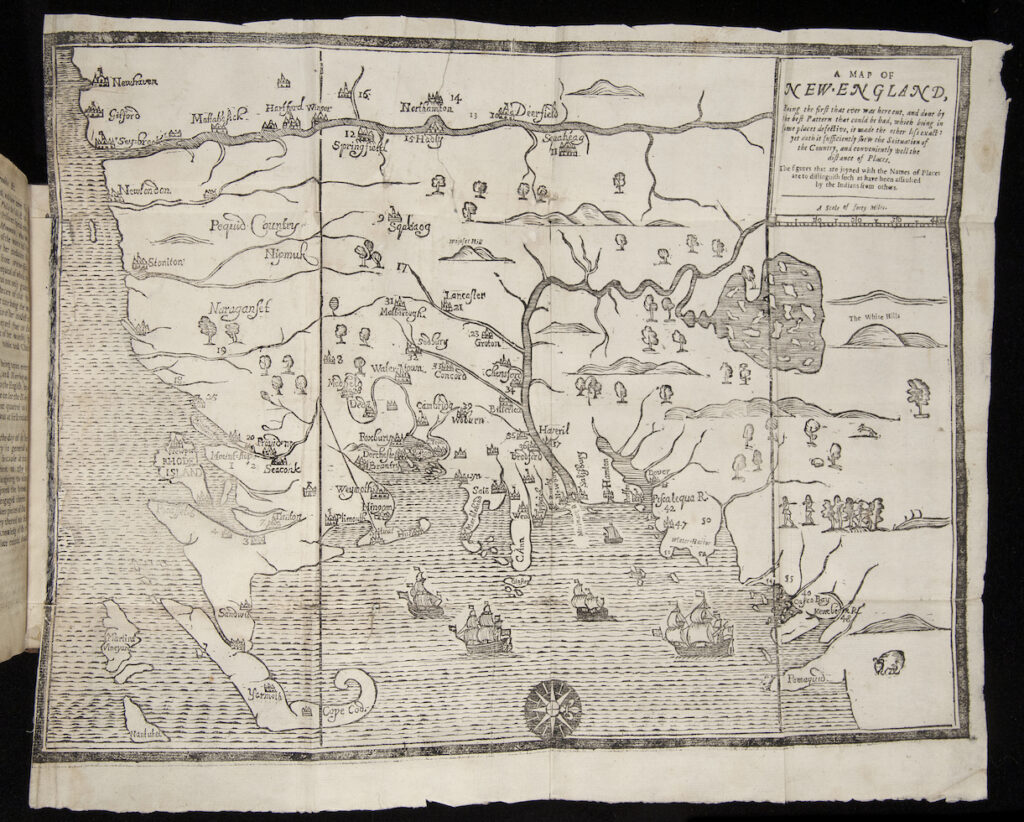
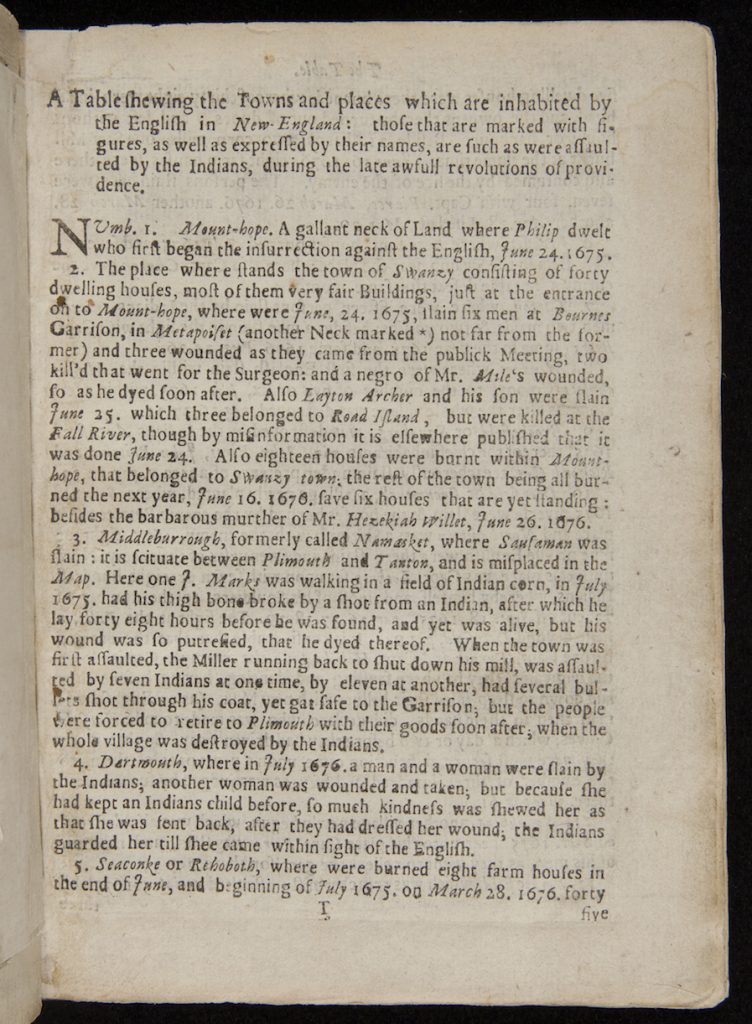
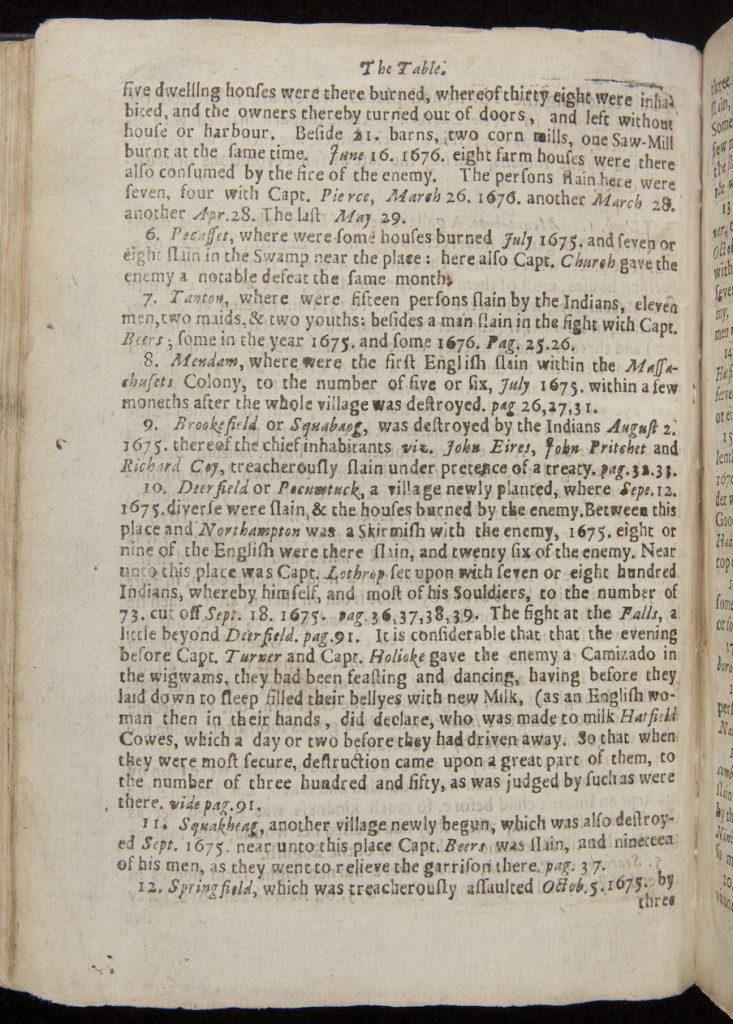
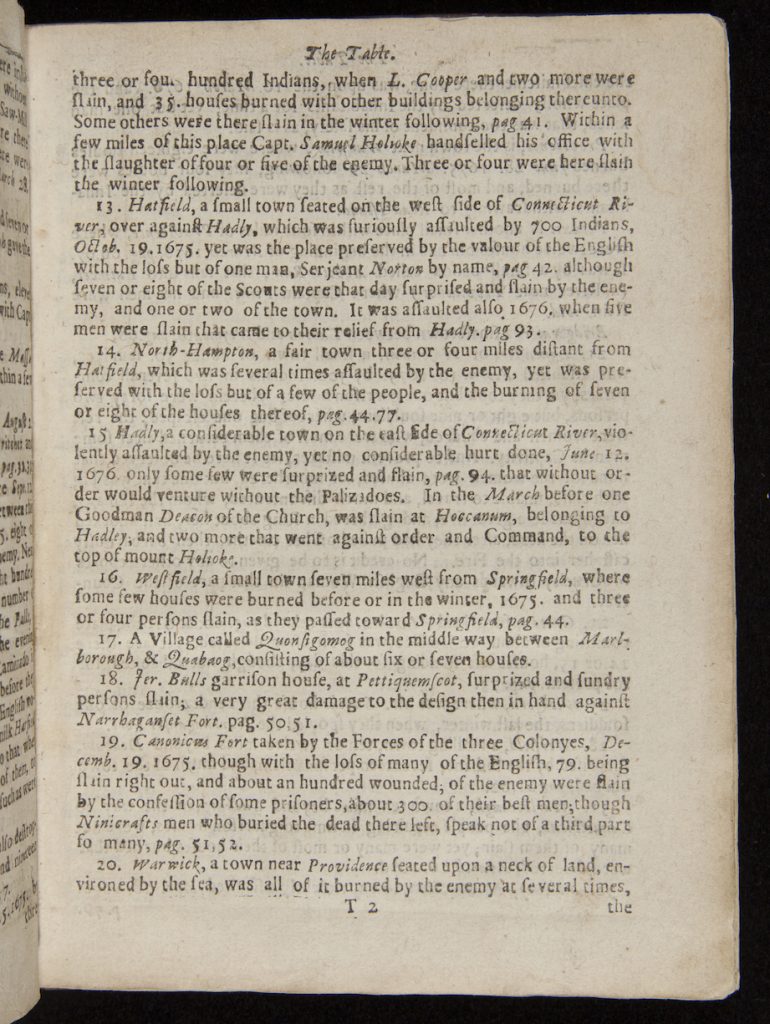
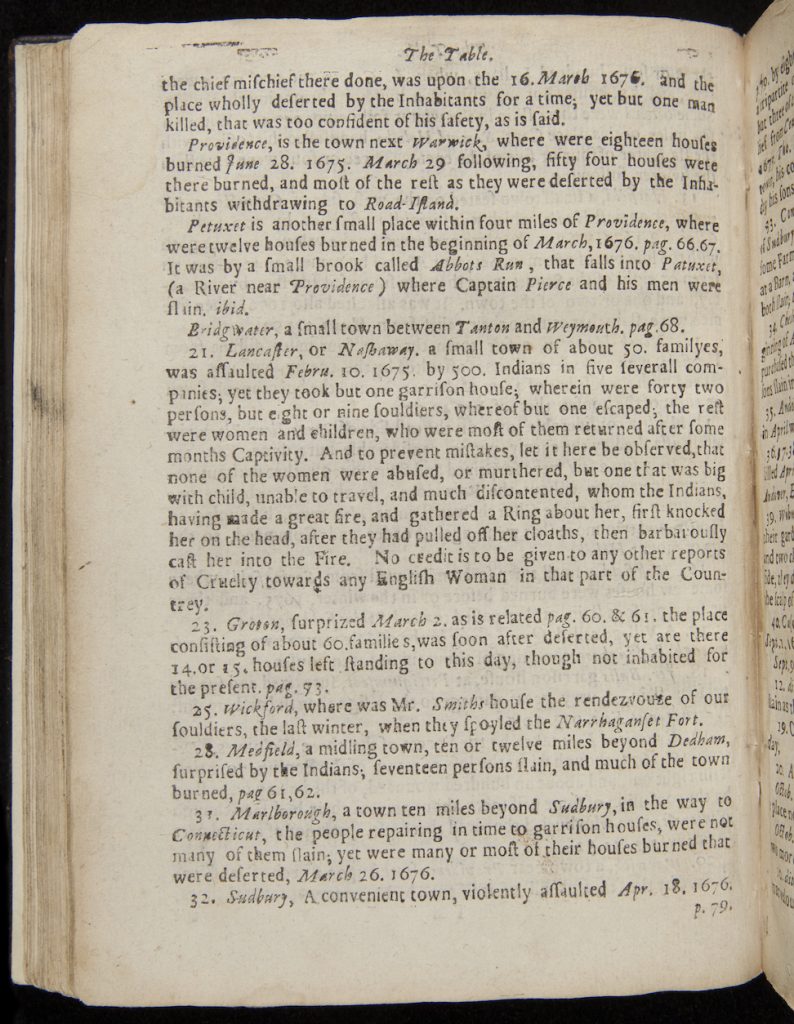
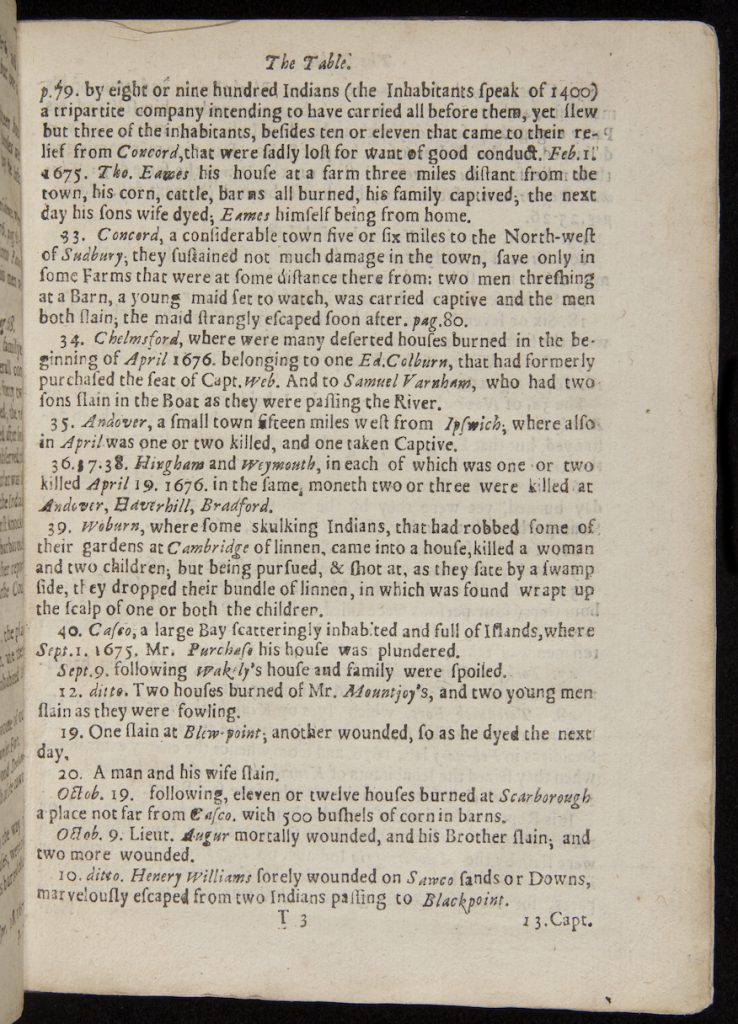
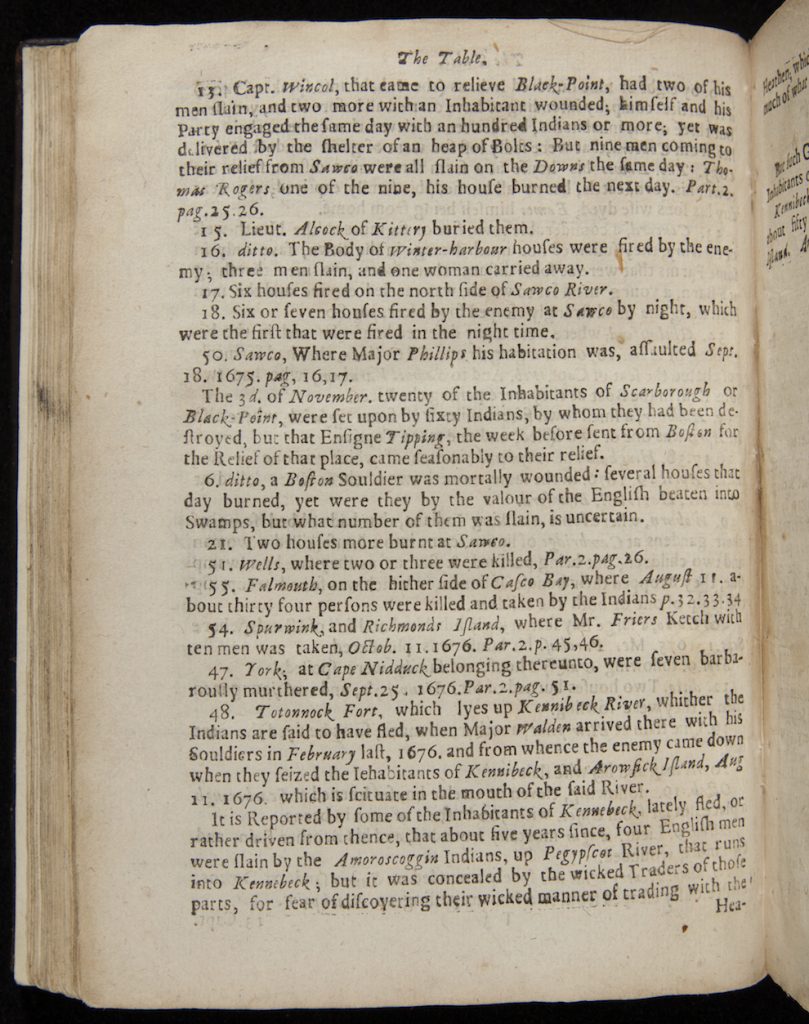
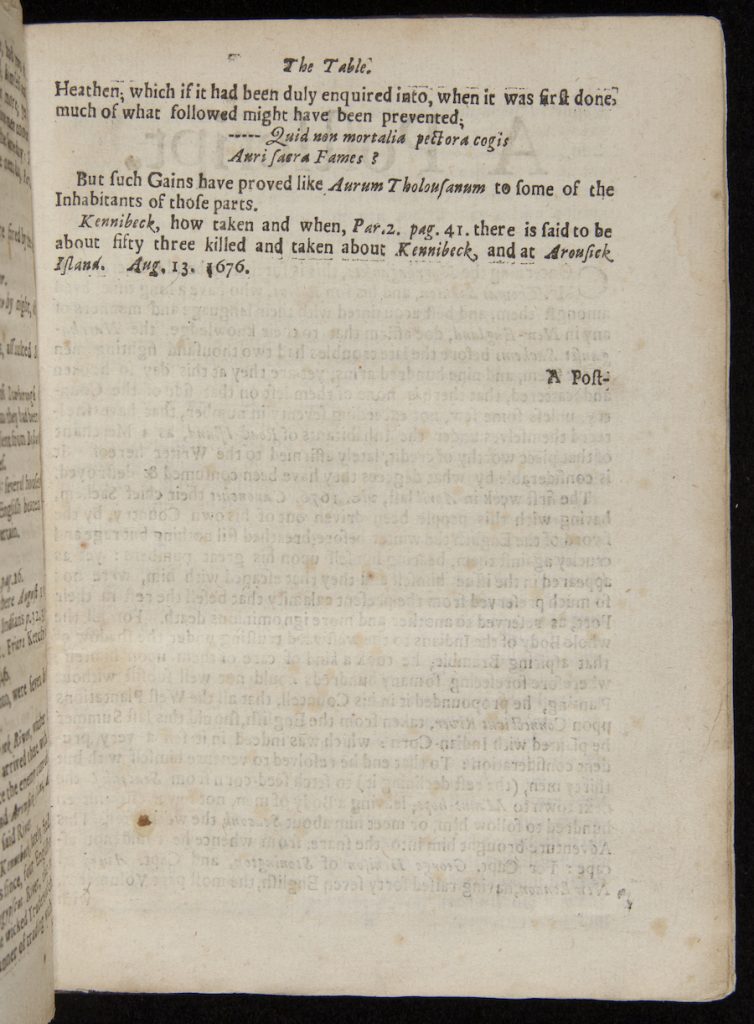
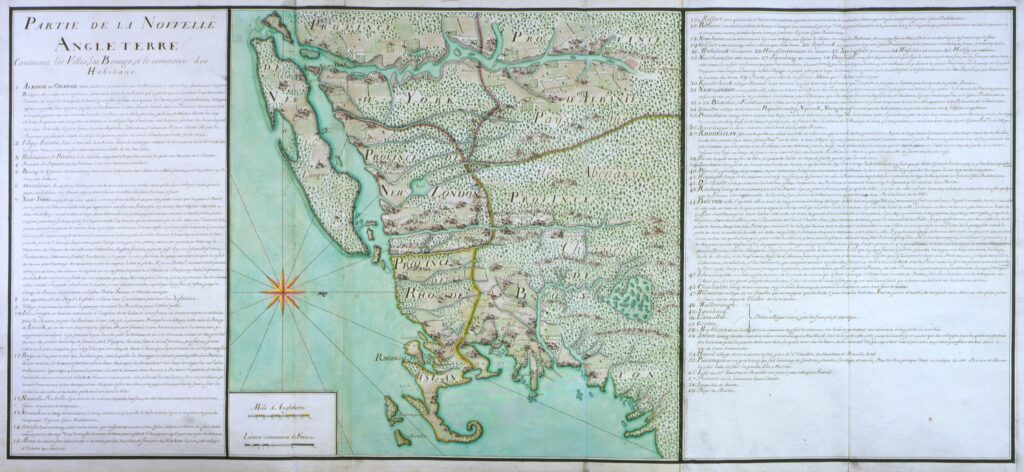
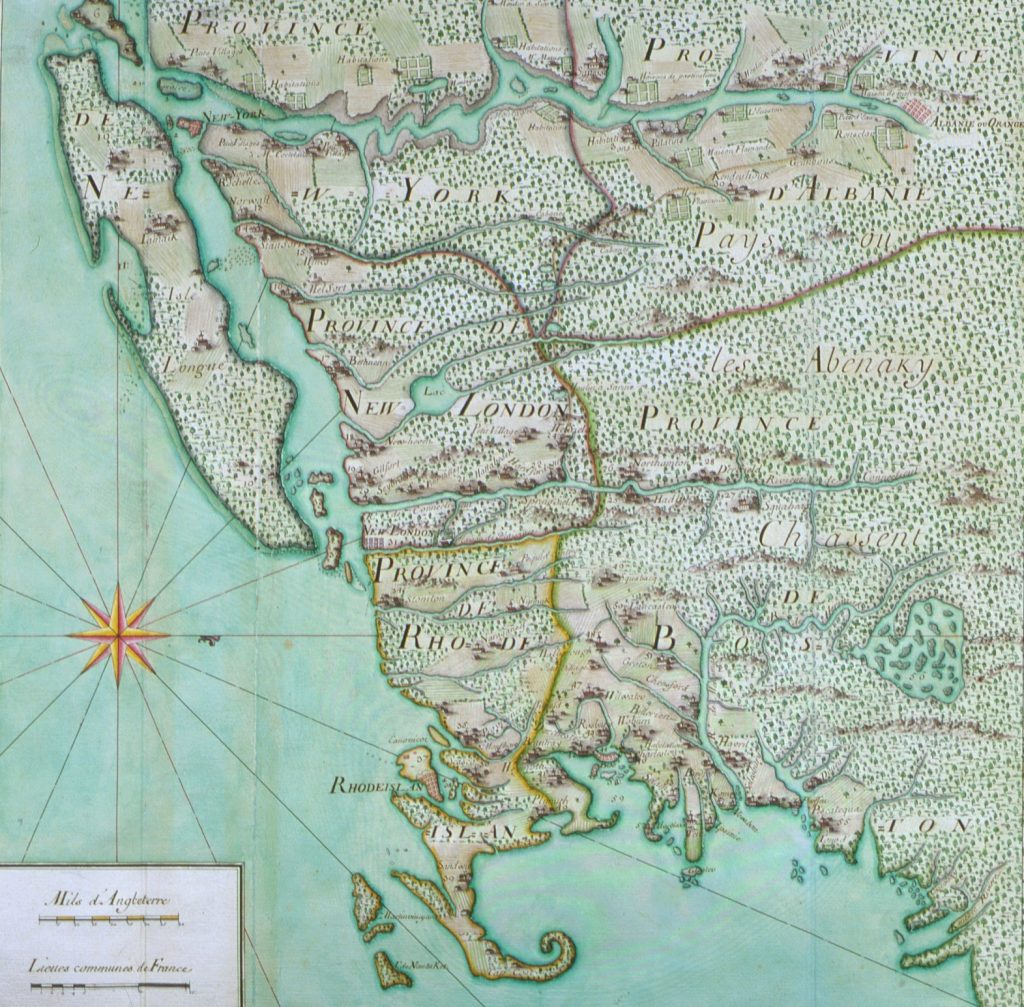
King Philip’s War failed to establish New England’s definitive bounds, or assure English control over the region. Throughout the early eighteenth century, French colonists and their Indigenous allies repeatedly attacked English settlements along the frontiers of Massachusetts and New Hampshire. The anonymous creator of the third map of New England (likely a French spy) borrowed heavily from Foster’s earlier map, but adapted the explanatory key to include details about English fortifications and the number of houses and armed men in each town. Rather than telling the history of a past war, the cartographer designed this map to help French colonists conduct an ongoing battle.
Questions to Consider
Related Classroom Materials:
John Foster’s 1677 map and William Hubbard’s 1677 A Narrative of the Troubles with the Indians in New-England appear in the C3 Activity Grades 9-12.
Nicolaes Visscher’s 1690 map “Novi Belgii Novaeque Angliae” and John Foster’s 1677 “A Map of New-England” appear in the Document-Based Questions for this Collection.
All the maps in this section appear in the Unit Plan Grades 6-12.
These maps are examples of early European cartographers’ depictions of North America, which drew from and synthesized information from an array of other sources.
These images shed light on the ways that European powers used cartography to define, bolster, and expand their North American empires as well as how Europeans imagined colonial spaces.
These documents provide both English and Indigenous perspectives on seventeenth-century Virginia, illustrating the reliance of the English in the colony on Indigenous knowledge and the both contested and porous boundaries between these populations.
As these maps demonstrate, the region of New England was defined and redefined by its inhabitants, including French, Dutch, English, and Indigenous peoples, and conflicts between these populations over the course of the seventeenth and eighteenth century.
James R. Akerman and Robert W. Karrow, eds. Maps: Finding Our Place in the World. Chicago: University of Chicago Press, 2007.
Sara Austin, ed. Cartographic Treasures of the Newberry Library: The Newberry Library, October 10, 2001–January 19, 2002. Chicago: Newberry Library, 2001.
Martin Brückner, ed. Early American Cartographies. Chapel Hill: University of North Carolina Press, 2011.
Barbara B. McCorkle. New England in Early Printed Maps, 1513 to 1800: An Illustrated Guide. Providence, R.I.: John Carter Brown Library, 2001.
Michael P. Conzen and Diane Dillon. Mapping Manifest Destiny: Chicago and the American West. Chicago: Newberry Library, 2007.
William Patterson Cumming. The Southeast in Early Maps. 3rd ed. Edited by Louis De Vorsey. Chapel Hill: University of North Carolina Press, 1998.
J.B. Harley and David Woodward, eds. The History of Cartography. 2 vols. Chicago: University of Chicago Press, 1987—.
James Horn. A Land As God Made It: Jamestown and the Birth of America. New York: Basic Books, 2005.
Ken MacMillan. “Sovereignty ‘More Plainly Described’: Early English Maps of North America, 1580–1625.” Journal of British Studies, vol. 42, no. 4 (October 2003): 413–447.
Mapping the French Empire in North America: An Interpretive Guide to the Exhibition Mounted at the Newberry Library on the Occasion of the Seventeenth Annual Conference of the French Colonial Historical Society. Catalog prepared by David Buisseret. Chicago: Newberry Library, 1991.
Dumont de Montigny. The Memoir of Lieutenant Dumont, 1715–1747: A Sojourner in the French Atlantic. Translated by Gordon M. Sayre. Edited by Gordon M. Sayre and Carla Zecher. Chapel Hill: University of North Carolina Press, 2012.
The Newberry 125: Stories of Our Collection. Introduction by David Spadafora. Chicago: Newberry Library, 2012.
Benjamin Schmidt. “Mapping an Empire: Cartographic and Colonial Rivalry in Seventeenth-Century Dutch and English North America.” William and Mary Quarterly, 3rd ser., 54, 3 (July 1997): 549–578.
John R. Short. Cartographic Encounters: Indigenous Peoples and the Exploration of the New World. London: Reaktion Books, 2009.