Curriculum Connections: American Imperialism, European Imperialism, Colonial and Revolutionary Period, Maps, Visual Literacy
Unit Plan Summary
Duration: 4 days
Suitable for: Grades 6-12
Schedule:
Day 1: What’s a Map for?
Day 2: Decoding Historical Maps
Day 3: Interpreting Historical Maps
Day 4: Assessing Map Interpretation
Essential Questions:
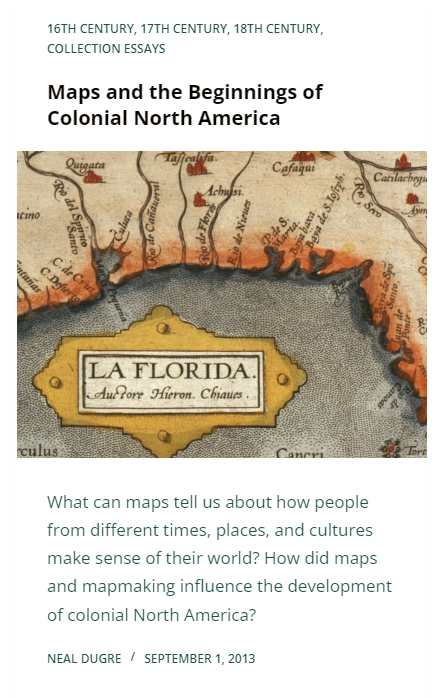
What can maps tell us about people from different times, places, and cultures?
What can maps tell us about how these people make sense of their world?
How did maps and mapmaking influence the development of colonial North America?
Lesson Plan Overview and Learning Goals:
In this four-day lesson, students will explore the visual record left by cartographers in North America during the colonial era. They will expand their basic geographic knowledge, develop their skills of visual interpretation, and apply principles of historical empathy (i.e. imagining the perspectives of historical actors in their contexts).
By the time they complete this lesson, students will be able to:
Identify major regions, landforms, and bodies of water in North America.
Identify the major European colonial powers staking land claims in North America between the sixteenth and eighteenth centuries.
Apply skills of visual literacy to historical maps, reading for technical information, artistic style, author’s purpose, audience, and historical context.
Articulate, in their own words, how maps contain information beyond geographic knowledge—about the power relations between X and Y, as well as cultural attitudes and economic motives of the people who made and used them.
Apply their own skills of visual representation by drawing their own maps based on physical and textual information.
Evaluate the validity of an interpretation of visual evidence by tracking and assessing the relationship of claims to evidence.
Materials Needed:
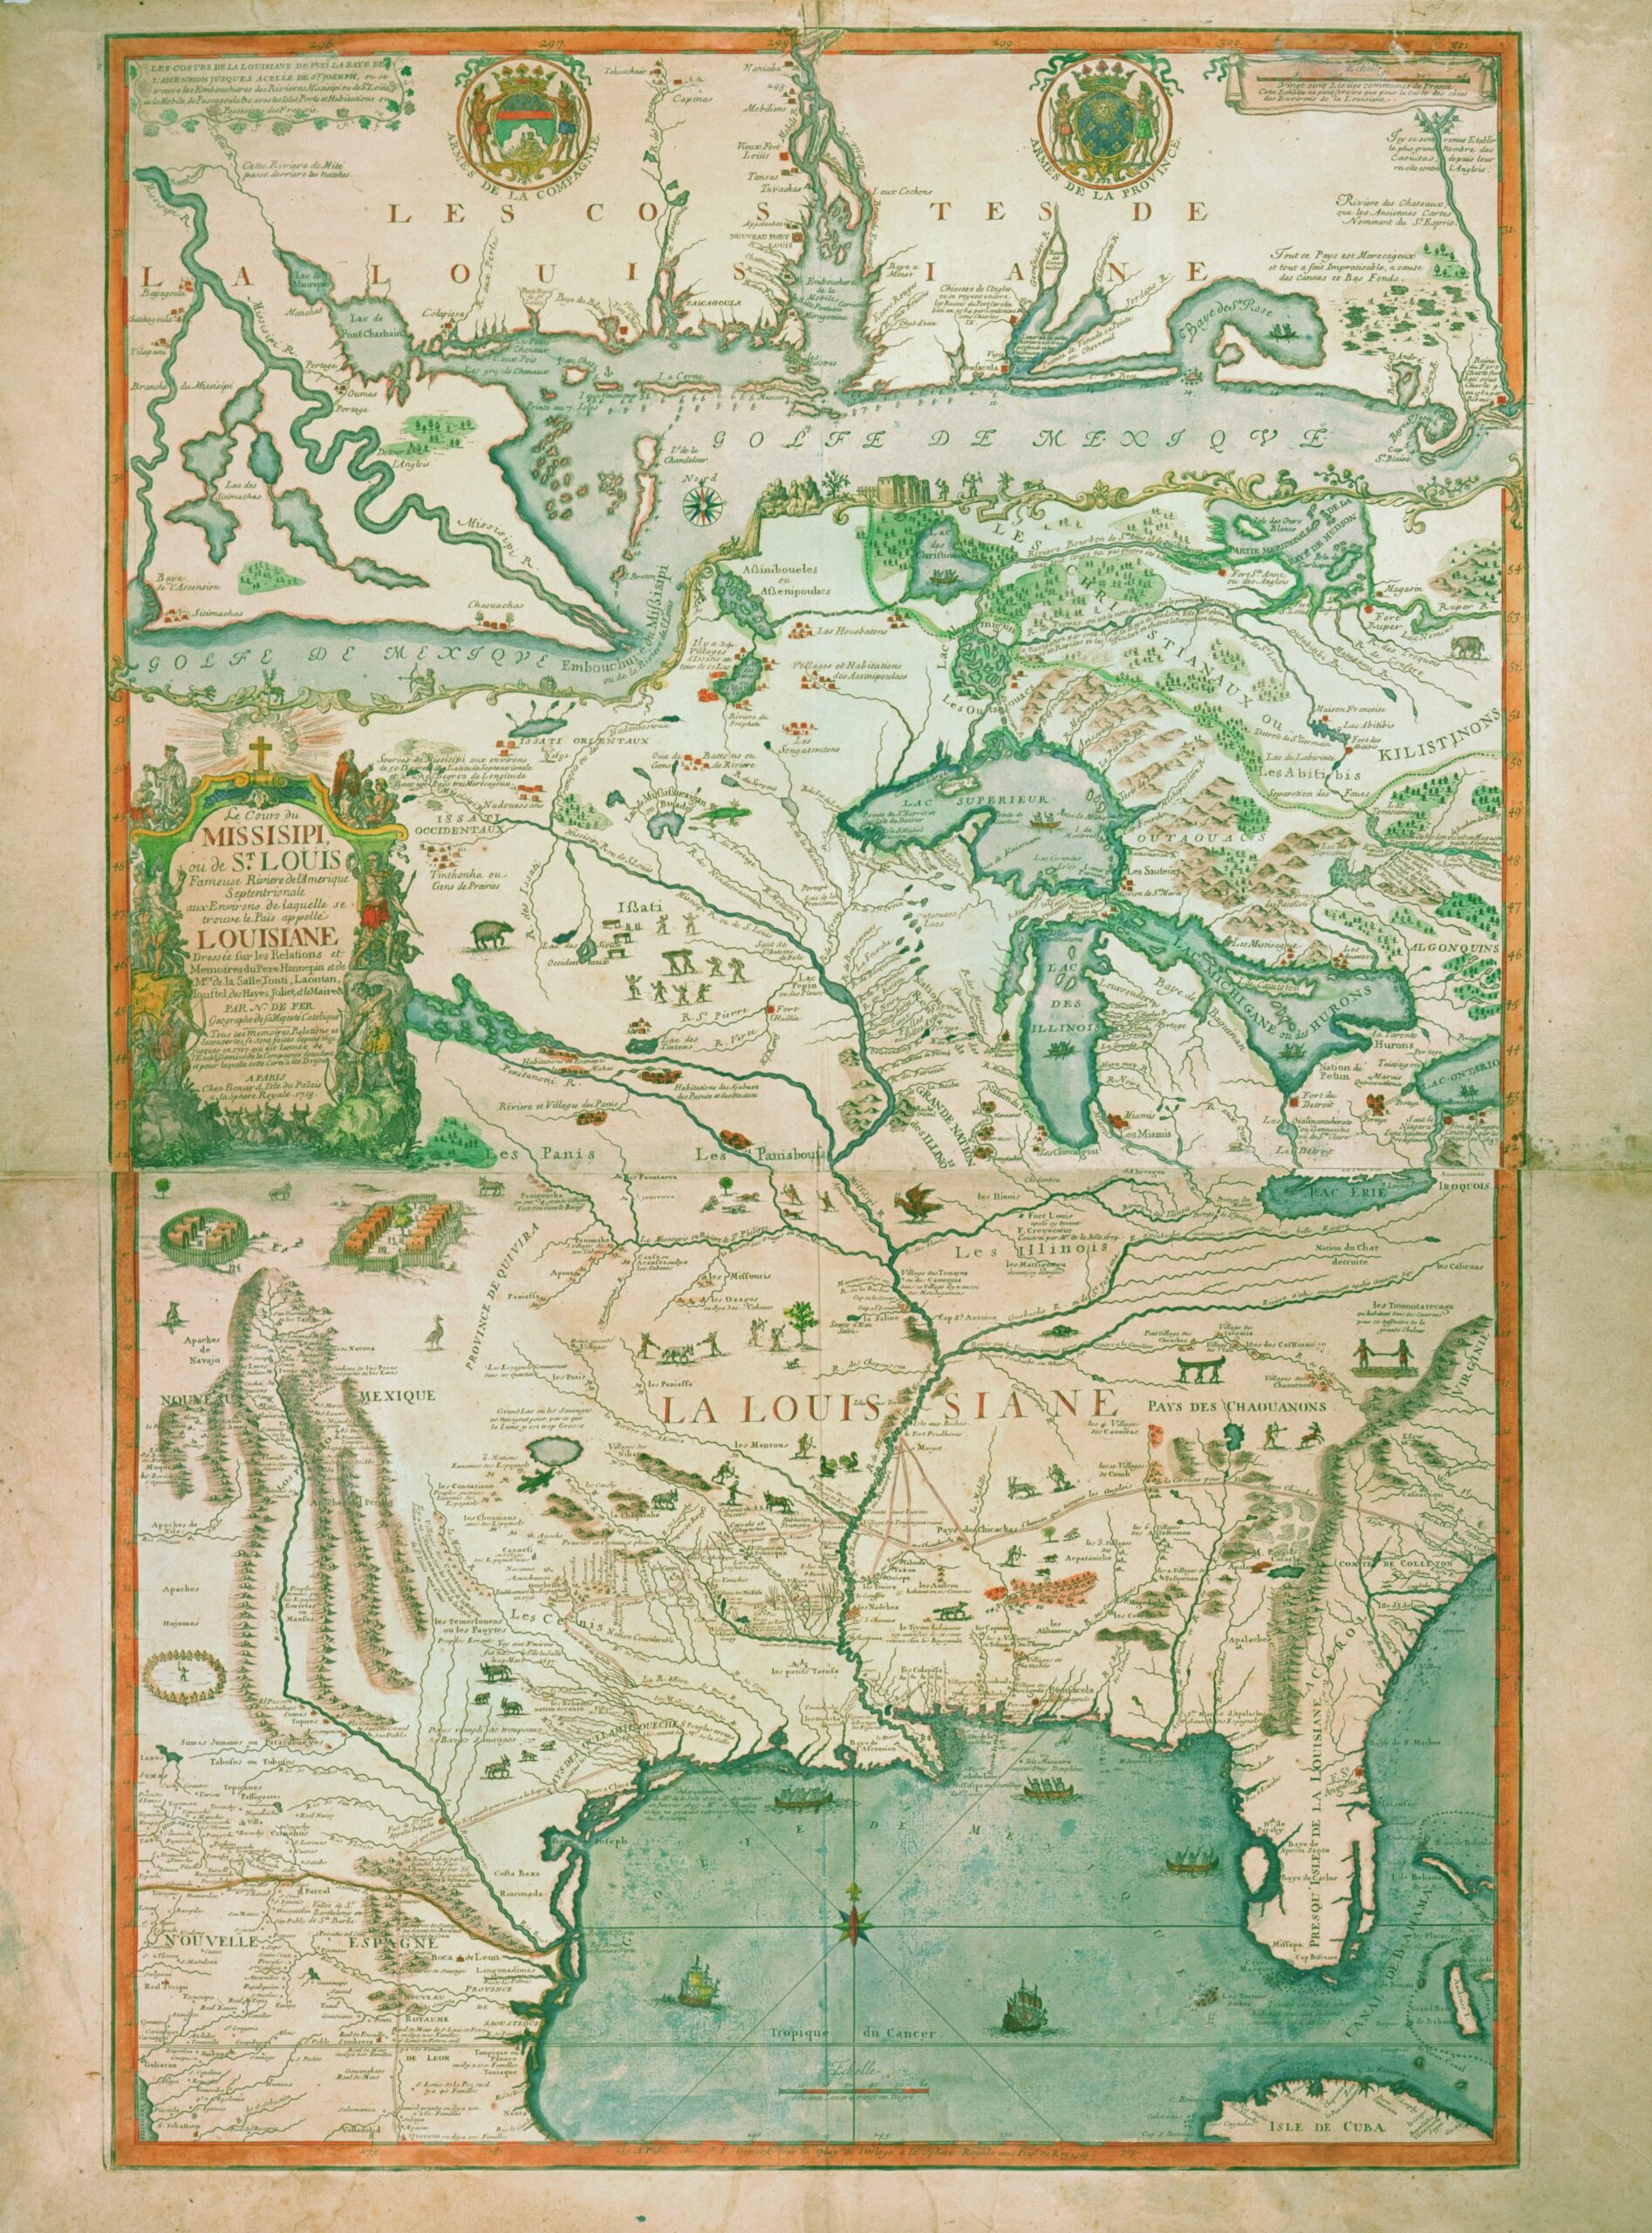
Photocopied handouts of the maps in the Newberry Digital Collection Maps and the Beginnings of Colonial North America, 1 map per standard 8.5” x 11” page, with caption details printed on the reverse.
Objectives: Students will access prior knowledge about basic principles of map-making: projection of space; generalization of detail; symbology and labeling; distance and scale. Students will articulate how context and purpose determine the look and content of maps.
Lesson Plan:
Engage:
Ask students to respond to the question in whole-group discussion: What is a map for? Track student responses to the prompt on the board, synthesizing toward major themes: that maps show 3D space on a 2D surface; that maps help people find their way around; that maps communicate information to people about places before they get there; that maps help people with particular tasks—driving, hiking, building, farming, waging war, defining property, etc. Announce that this week students will learn what maps did for European colonists in North America, but that they’re going to start by mapping their own classroom.
Break students into groups of four or five. At each table, give students a blank Post-It poster and a set of colored pencils. Instruct the whole group that they will be creating a map of the classroom. The map must be clear, complete, and colorful. It should include legible labels, and have a key/legend.
Explore:
As soon as the students begin working, visit each group and provide them with a “secret” instruction (these can be printed on slips of paper). Each group will get a slightly different purpose/audience. (Repeat these purposes as needed, depending on how many groups you have.)
Explain and Elaborate:
Once all students have completed their maps, invite them to post them on the wall and conduct a gallery walk. In a gallery walk, all work is publicly posted and students get up and walk through the “exhibits” in timed clusters (to control traffic) and with a critical purpose (supplied by the teacher). As students inspect each map, they will take notes in their notebook about what the maps emphasize or what they leave out, and major differences they notice between the maps. Ask them to track issues of style, clarity, scale, and detail.
Evaluate:
After students return to their seats, conduct a whole-group discussion of what these differences were and how they would affect your use of the map. Have students reveal the “secret” mission they had and reflect on whether these instructions explain the differences across the maps they drew. Conclude discussion with the conceptual takeaway: that maps express realities that we all can see, but they also reflect the contexts and purposes that the mapmakers bring to their work, allowing for a range of interpretations.
Homework:
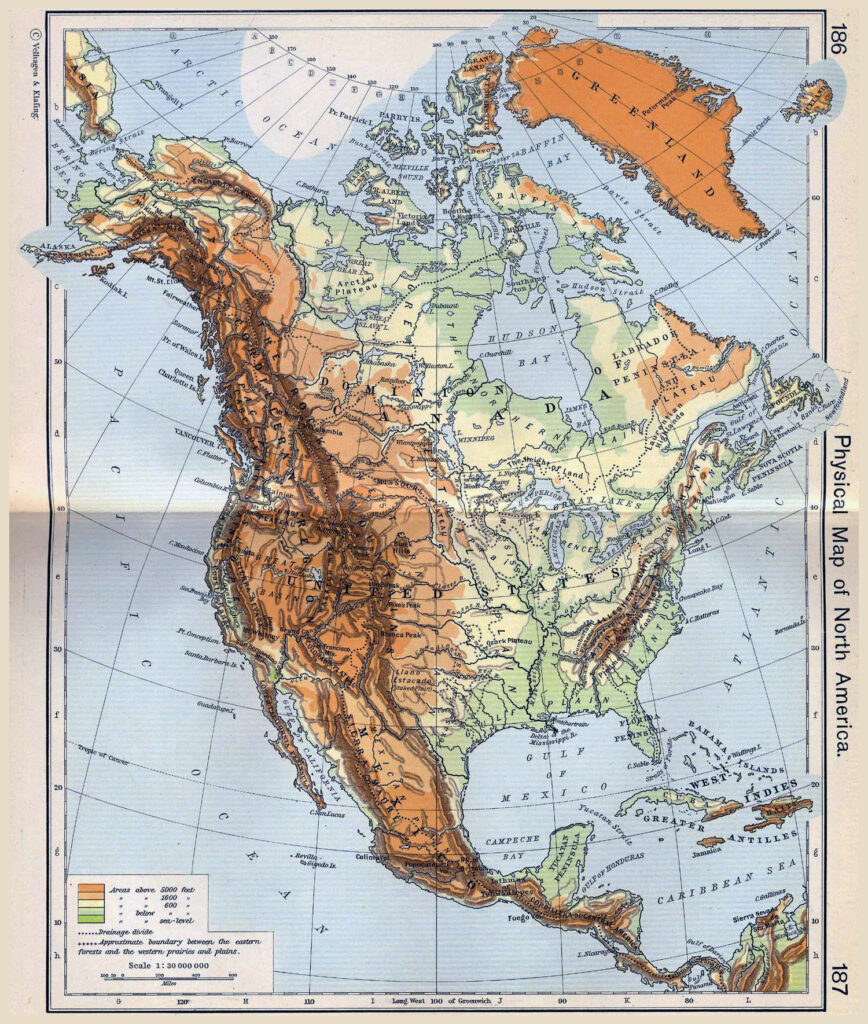
Hand out the two contemporary maps of North America. Instruct the students that they need to study the labeled map to discover the location of the following landforms and then label them on the blank map on the reverse side. Explain that this will form the basic knowledge for our next activity, and that they will be quizzed on these at the end of the week: Florida Peninsula; Hispaniola; Baja California; Gulf of Mexico; Caribbean Sea; Mississippi River; Missouri River; Great Lakes (Superior, Michigan, Huron, Erie, Ontario); Hudson Bay; Gulf of Saint Lawrence; Chesapeake Bay.
Day 2: Decoding Historical Maps
Materials Needed: Printout packets of the maps in the Maps and the Beginnings of Colonial North America Digital Collection (1 map per standard 8.5” x 11” page, with caption details printed on the reverse—one packet for each student-group of four or five. Available for download at the top of this page.); Large-format (11”x17” or larger) printouts of the contemporary blank North America map—one per student group.
Objectives: Students will be able to name the major players and places that shaped the course of European colonization in the New World between the fifteenth and eighteenth century. Students will be able to apply this context to decode maps colonial-era maps for basic geographic information and compare them to contemporary geographic knowledge.
Lesson Plan:
Engage:
On the projector, show students a satellite image of the Atlantic Ocean, and a timeline marking a span between 1450 and 1750. Explain that in 1450, the people on either side of the map (North & South America on one side and Europe and Africa on the other) had no knowledge of each other. Over the next 300 years, European powers (in waves of exploration, war, conquest, diplomacy, religious mission, emigration, slave-trade, and colonization) would stake claims over land, resources, and people in the New World. As part of their efforts to seize, settle, and develop various pieces of both continents, Europeans made tons and tons of maps. While over a dozen European kingdoms attempted to establish colonies in the Americas, the Spanish, Portuguese, French, and English became the major players. In North America, French, Spanish, English, and Dutch colonials competed with each to establish colonies.
Explore:
With students in groups, distribute the stack of eleven maps to each group (for this activity, the Smith and Vaughan maps of Virginia can be grouped as one source). Instruct students that they will establish the “provenance,” “orientation,” and “magnification” of each map. Define the terms on the board: provenance- when and where it came from; orientation- the location of north and south on the map; magnification- the scale of the snapshot taken of the earth. To accomplish this, have students proceed through these steps.
Begin by stacking them in chronological order.
Next, tag each one with a color to indicate which European power (French=blue, Spanish=yellow, English=red, Dutch=orange) commissioned the map.
Then, distribute a larger-format blank map of North America to each table. Instruct students to figure out how each historical map is oriented and magnified. (They may need significant help with the Virginia and New England maps, and hints for others).
As a group, they’ll then draw eleven rectangular frames onto the big blank map to represent each snapshot of North America. It should look something like the map below.
Explain and Elaborate:
After all groups have completed their drawing, lead a discussion to get students to articulate their process. What was difficult about this task? What was most misleading or confusing about these maps? What information was most helpful in resolving the confusion? What made certain maps easier to work with than others?
Evaluate:
Have students do a pair/share to identify the differences in geographic knowledge that they noticed—both between each historical map, and between the historical maps and what we know today about the shape and size of these landforms and bodies of water. In whole-group discussion, have students hypothesize the historical reasons why there may have been such different renderings. Help students convene on two major ideas: that European colonists had limitations on what they could see, measure, and verify about the lands they drew; and that European mapmakers had distinct purposes for each map, which determined what they thought would be most important (i.e. showing the conduct of a war or the placement of a plantation might have been more important than whether the map was “upside-down” in orientation).
Objectives: Students will be able to read the same primary sources with different interpretive objectives. Students will build confidence in reading visual information from historical sources (including maps) to build inferences about the cultural and political contexts that produced them.
Lesson Plan
Engage:
Begin by projecting a copy of the Baptista Boazio’s 1588 image onto the screen for the class to see.
Explain that, as you discovered yesterday, this was in fact a map of the island of Hispaniola—a fact that the group who worked with it probably needed help to figure out. Ask students to look at the image together and ask questions about what other information—aside from the shape and location of land, water, and settlements—can be found in the image. Students will discover a range of information, including detailed renderings of the soldiers and ships.
Explain and Elaborate:
Then, ask students to speculate as to the purpose that this mapmaker may have had when he drew it. Help students come around to the notion of a map as a narrative, with characters, settings, symbols, plot points, and moral lessons.
Explain that in this case, the map was drawn by an Italian artist who published it in an English book about the adventures of Sir Francis Drake. Explain that at the end of the sixteenth century, while Spain had laid claim to a vast empire in the New World, England was just beginning to flex its military muscle in overseas colonies. Explain that Drake was an English pirate whose attacks on Spanish ships and settlements helped England build its strength as an Atlantic power under Queen Elizabeth I. In this context, we can see the map as a piece of English self-promotion—a poster to brag about their prowess on the high seas and the New World (even if Drake’s occupation of this relatively small town lasted only a month).
Explore:
With students in four groups, pass out pre-sorted map pairs to each group, and tell them that they will be looking at each map in a close reading of the story and purpose of the map. Group maps in the following way:
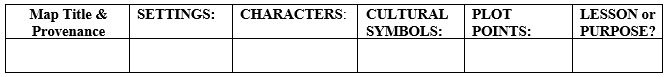
For each map , instruct students to team together to conduct a close reading of the visual information that tells the map’s story—its emphasized settings or locations, its main characters (human or otherwise), its cultural symbols, plot points, and your best bet as to its lesson or purpose. Suggest the following graphic organizer, but explain that not every category is likely to be filled.
Evaluate:
Reconvene students in whole-group discussion. Ask students to describe what was most difficult about reading visual information, what visuals were easier to read as “stories,” and what clues they used to help settle on their guess as to the purpose or lesson of the map. Explain that tomorrow, students will have to present their interpretations to another group, whose job it will be to critically assess their interpretation. In the last five minutes of class, give students a chance to assign roles to each other for tomorrow’s presentation, and to assign any loose ends to each other for homework.
Objective: Students will build confidence explaining their visual analysis to peers and assessing peer presentations. Students will be able to apply their skills at reading primary sources to modern maps.
Lesson Plan:
Engage:
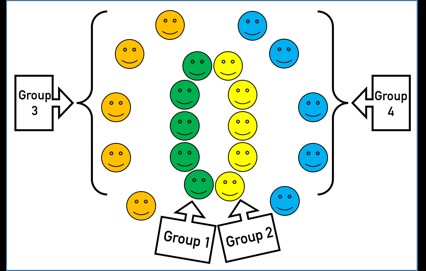
Announce that today’s presentations will be conducted as a two-part fishbowl. In a fishbowl, subgroups of students conduct their own discussion (the fish in the bowl), while you and another subgroup of students observe from the periphery and track the content and quality of the discussion. Below is a suggested diagram for students to use:
Groups 1 & 2 will present to one another while groups 3 & 4 watch and track the details on a note-taker. Then, the roles will reverse. Show students a visual of a fishbowl discussion to remind them of the structure. Emphasize that although the teacher will grade you on the strength of your participation in each role, this is not a debate with winner and a loser, but a discussion aimed at developing a more detailed and nuanced reading of our sources. Below is a diagram of a fishbowl setup:
Explore and Evaluate:
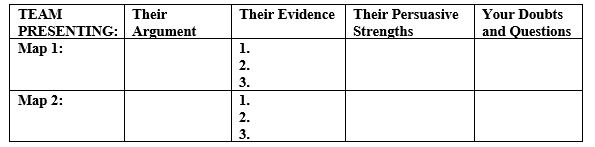
Fishbowl: Explain that as the fishbowl proceeds, students will take roles as either presenters, reviewers, or observers. Tell them that they should organize their presentation in the reverse order than the chart they constructed: They should announce their claim about what they think the map’s main purpose might have been, and then support this claim by pointing to the visual evidence they’ve collected from the image. The exchange should follow this format:
Explain and Conclude:
Explain to students that they have achieved a new and more sophisticated understanding of maps: they have seen how maps can serve as reliable records of spatial information and as historical artifacts of power relations, cultural attitudes, and economic motives. Remind students that this remains as true today as it did in the colonial era.
As a closing discussion to reinforce this point, bring up the home page for Google Earth and ask them to read it as a story. Observe the loading message about “the world’s most detailed globe,” which jokes about cataloguing grains of sand. Navigate the menu to show the “map styles,” “voyager,” and “street view” options. Use the search bar to search for Santo Domingo, the site of Francis Drake’s attack in the 1580s, and try viewing the city via the different options. Ask students to consider what mapmakers at Google seem to be prioritizing, and who they think is using their maps. What is similar or distinct about what consumers of maps seem to care about today, as opposed to those who used the colonial maps of North America that we studied this week?
About the Author
Nicholas Kryczka is a Postdoctoral Fellow in the Social Sciences and the Department of History at the University of Chicago. He teaches coursework in American Civilization, urban history, and oral history and conducts research on the history of post-civil rights school reform in Chicago. Previously, Nick worked for a decade as a high school social studies teacher in the Chicago Public Schools.