Curriculum Connections: European Imperialism, Geography, Maps, Visual Literacy
Activity Summary
Duration: 1 hour and 10 minutes
Suitable for: Grades 3-5
Students will practice using basic tools of visual literacy:
Students will gain familiarity with broad categories of geographic knowledge necessary for understanding the era of European colonization in the New World.
Students will construct and apply a definition of maps that includes both their function as a realistic picture of space and as a set of choices made by a mapmaker.
How is a map like a picture? How is it different?
Why do people make maps?
Lesson Plan
Announce to the students that you’re going to show them a picture. Tell them that you want them to look very closely at the picture for three minutes, looking at all parts of the picture, and without anyone talking.
Ask students for raised hands in response to this question to the whole group: “What’s going on in this picture?” As you take answers from each student, paraphrase their responses, saying “What I hear you saying is…” For further guidance on the Visual Thinking Strategies (VTS), see vtshome.org or Philip Yenawine, Visual Thinking Strategies, (Cambridge: Harvard Education Press, 2013).
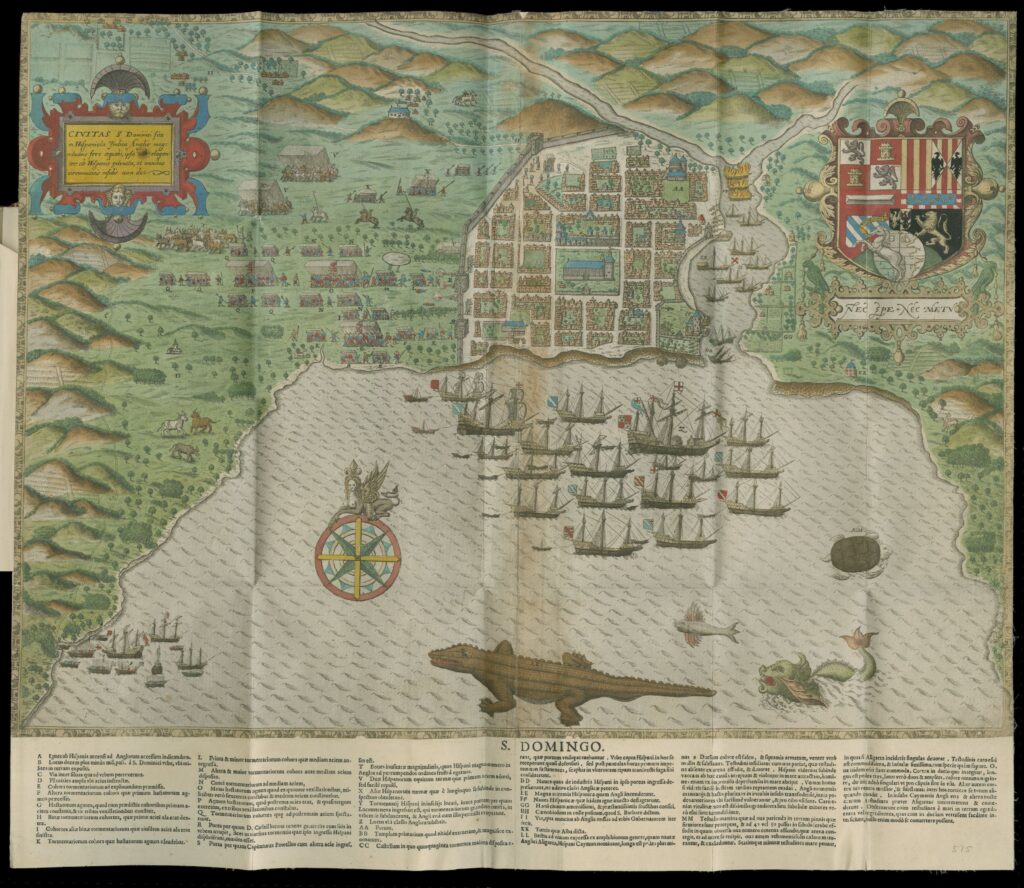
As more and more students describe what they see, look for interpretive observations, where students infer more than what is simply there, or where they compare the content to other imagery they’ve seen elsewhere. For example, students may say that the boats look like pirate ships, or that the creature looks like an alligator, or that the men look like knights, or that the image “looks old.” When they do this, ask “What makes you say that?” As they make their way around the picture, push them to identify and name anything that they’ve missed: “What more can you find?”
After about ten minutes, show them magnified details of parts of the picture to help them complete their inventory of the visual information in the image. Ideally, students will notice elements like the fleet of ships, the giant sea creatures, the hills, the distinctions between land and water, the soldiers, flags, weapons, animals, the town with a wall around it, the three floating symbols (compass rose, coat of arms, label).
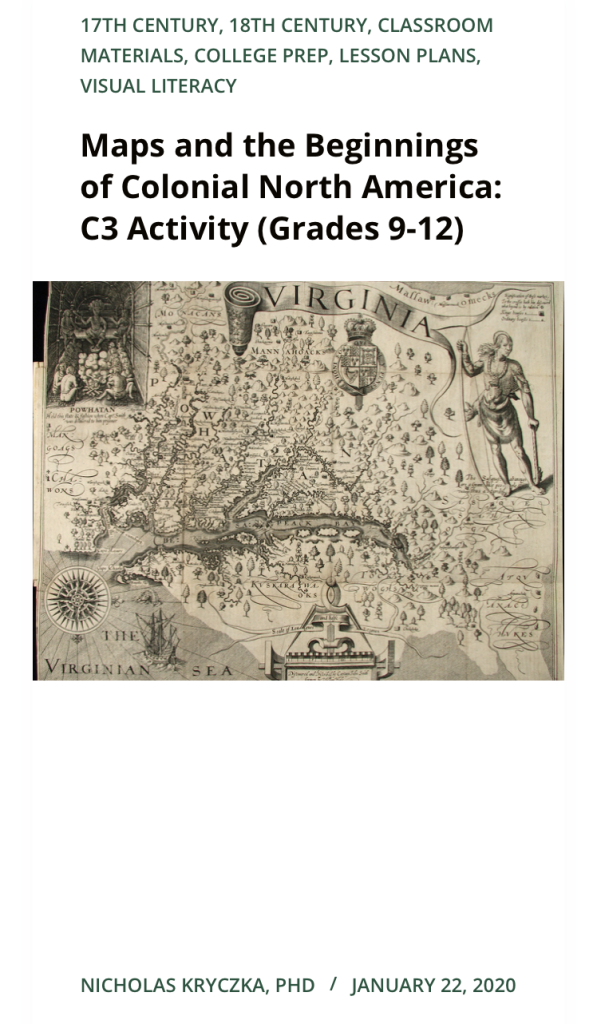
Project a satellite map of the Atlantic Ocean so you can point out the areas being discussed. Explain that the picture you just looked at was a drawing that told a story—a story about an English pirate who captured a town from the Spanish on an island in the Caribbean. (Point out where England, Spain, and the Caribbean are on the map). Explain that this was during a time when kings, queens, knights, and pirates from Europe fought against each other and against Indians as they tried to set up farms and cities in what they called the “New World”—North and South America. (Point out these on the map). The picture was drawn to celebrate the pirate’s adventure on the island, which was called Hispaniola. (Point out the island on the map). Explain that the picture is also a map because it tries to tell us important details about the shape of the land and water in a particular place on earth.
Tell students that you will do the same activity again, with another map, but this one was drawn later, by a different guy, and shows a different area.
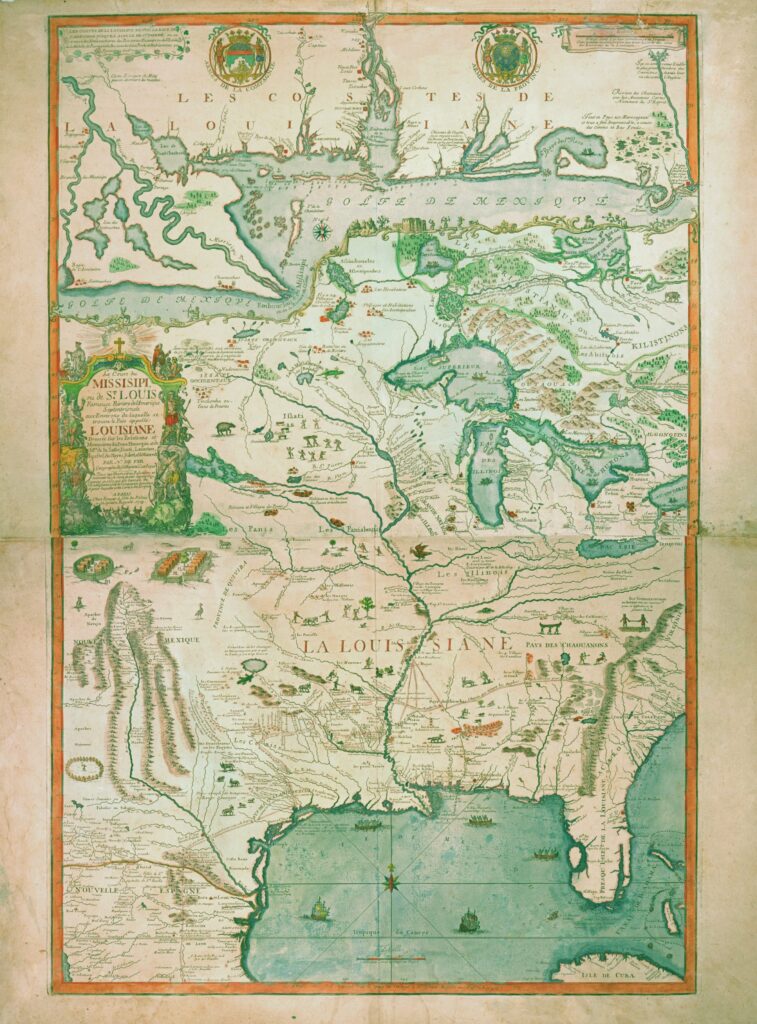
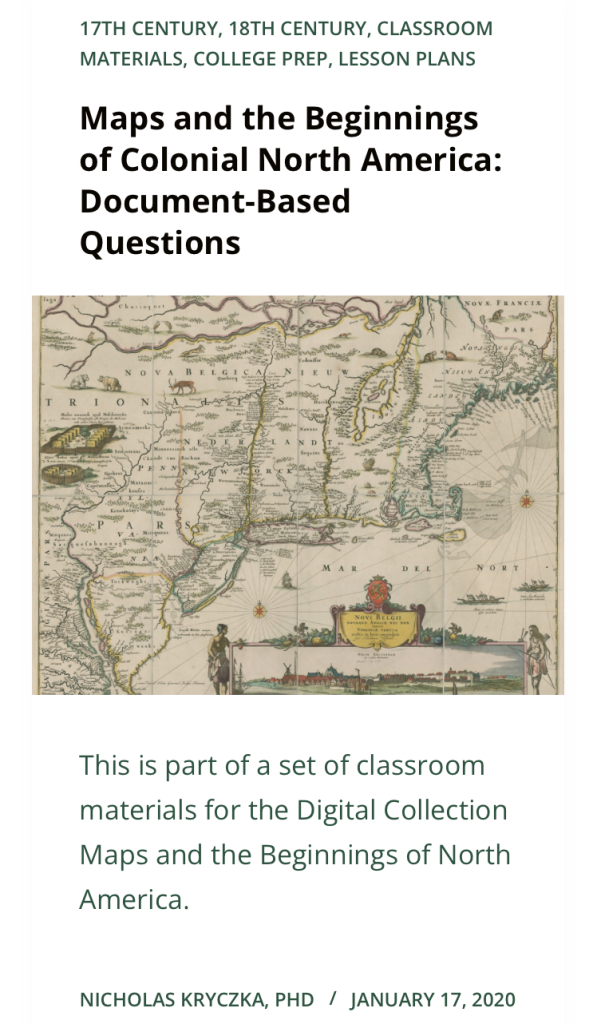
Project the complete image of Nicolas DeFer’s 1718 map Le cours du Missisipi. Follow the same cycle of questioning, paraphrasing, and pushing as you did with the first map. Again provide magnified details to help students discover all the visual information. By the end, they should have again found the land-and-water distinctions, the animals, people, towns, ships, and the figures that make up the decorative label on the side.
Once students have catalogued the visual information from the second image, bring the satellite image back up and explain that this map was drawn much later, as more adventurers from Europe began to set up more towns, forts, and farms across North America. (Point out the area represented by the map; use Florida as a helpful point of reference).
Bring up a new slide with map 1 and map 2 next to each other. Tell students to think about both maps again. Ask them what they thought was the same and what was different between the two maps. Use a compare and contrast t-chart or a Venn diagram to track the discussion. (If students are not familiar with these graphic organizers, build in time to explain).
Remind students that these are both maps. ask students, “So, what is a map”? Based on what was the same across both images, lead students to discover the basic premise—that maps represent 3D space (land, hills, water, etc.) on flat paper (or on some other surface or media). Based on what was different across both images, help students reach a second conclusion—that people who draw maps might have special reasons for drawing a map. In this case, one mapmaker wanted to show the power of one country by telling a story of a successful adventure. The second mapmaker hoped that by drawing the waterways of an entire continent, he could show the power of another country and encourage more people to travel, explore, or settle there.
C3 Framework Standards
Geography:
D2.Geo.2.3-5. Use maps, satellite images, photographs, and other representations to explain relationships between the locations of places and regions and their environmental characteristics
D2.Geo.3.3-5. Use maps of different scales to describe the locations of cultural and environmental characteristics
D2.Geo.4.3-5. Explain how culture influences the way people modify and adapt to their environments.
D2.Geo.5.3-5. Explain how the cultural and environmental characteristics of places change over time.
D2.Geo.6.3-5. Describe how environmental and cultural characteristics influence population distribution in specific places or regions.
History:
D2.His.3.3-5. Generate questions about individuals and groups who have shaped significant historical changes and continuities.
D2.His.5.3-5. Explain connections among historical contexts and people’s perspectives at the time.
D2.His.6.3-5. Describe how people’s perspectives shaped the historical sources they created.
D2.His.10.3-5. Compare information provided by different historical sources about the past.
D2.His.11.3-5. Infer the intended audience and purpose of a historical source from information within the source itself.
About the Author
Nicholas Kryczka is a Postdoctoral Fellow in the Social Sciences and the Department of History at the University of Chicago. He teaches coursework in American Civilization, urban history, and oral history and conducts research on the history of post-civil rights school reform in Chicago. Previously, Nick worked for a decade as a high school social studies teacher in the Chicago Public Schools.